Timeline
6 months
Client
PrestaShop
Deliverables
User Research
UI Design
KPIs Analysis
My role
Product Designer
01
Problem
PrestaShop is one of the world’s most popular ecommerce platforms, and most successful open source projects. They are a company and a global community.
Around the world, more than 300,000 ecommerce stores run on PrestaShop technology. Their mission is to develop world-class ecommerce software through open source innovation. Together with their community, they provide software that enables everyone to have a successful ecommerce business.
PrestaShop Metrics is a module developed internally with the objective to help merchants manage their data. A statistic page were already available on PrestaShop back-office but didn't answer the needs because:
Unreliable data
Some data provided by PrestaShop back-office were unreliable (especially traffic data).
Several tools needed to analyze data
Merchants use one or more external tools to analyze their online businesses. It's manual and time-consuming to aggregate those data from several platforms.
Lack of experience
Most of PrestaShop clients are from the SMBs segment (100K€ - 500K€ annual turnover). Those merchants have limited knowledge in terms of KPIs analysis, they need to be guided in their decisions.
To answer those needs, the PrestaShop Metrics module offers an aggregation of reliable data from Google Analytics and PrestaShop, with tooltips to guide users.
I joined the project a few months after the launch.
All the KPIs were below the target and we had to think of a new strategy to better meet user needs.

Throughout the project, I followed the double diamond methodology:
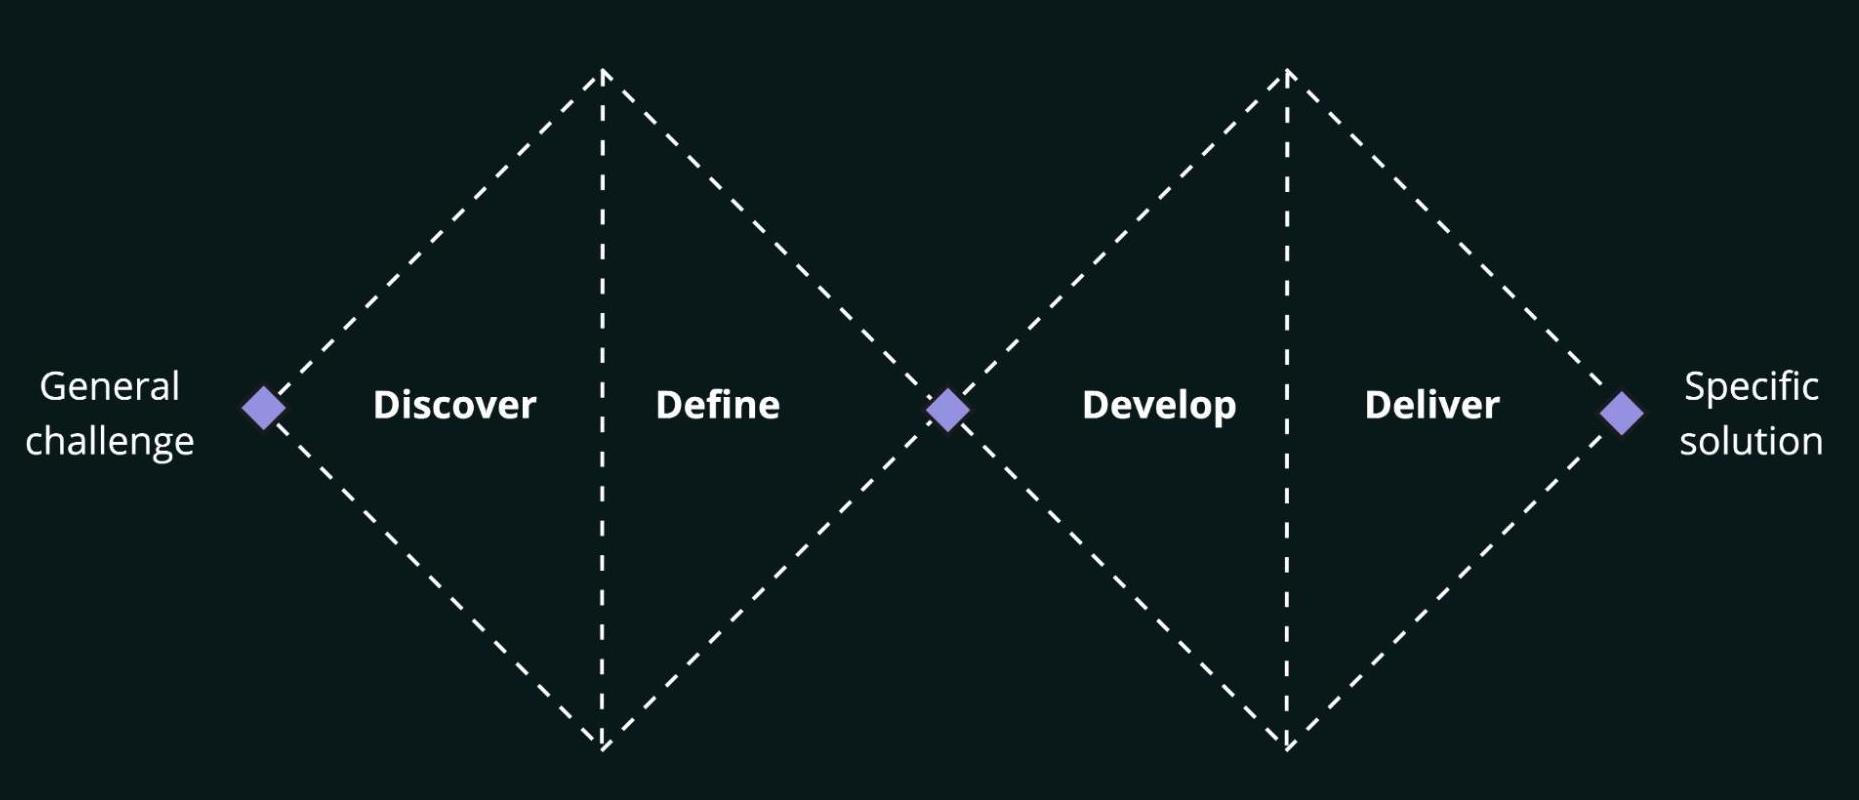
Before starting anything, I had a look at the competition, then I led qualitative and quantitative interviews. It helped me to understand users' day-to-day behaviors. Then, I synthesized all the insights and defined the project vision with PrestaShop's stakeholders.
Using UX tools and following the MVP approach, I iterated until I got a solution that meets users' needs.
02
Competitive Analysis
A competitive analysis provides strategic insights into the features, functions, flows, and feelings evoked by the design solutions of competitors.
I created a short list of main comparison criterias before starting the analysis (general infos, rating reviews, direct competitors, pricing, website..).
Then, I selected 3 main competitors: analytics tools plugged on a CMS and designed for small merchants.
Below is an extract of the analysis for Conversific, Little Data and OrderMetrics.
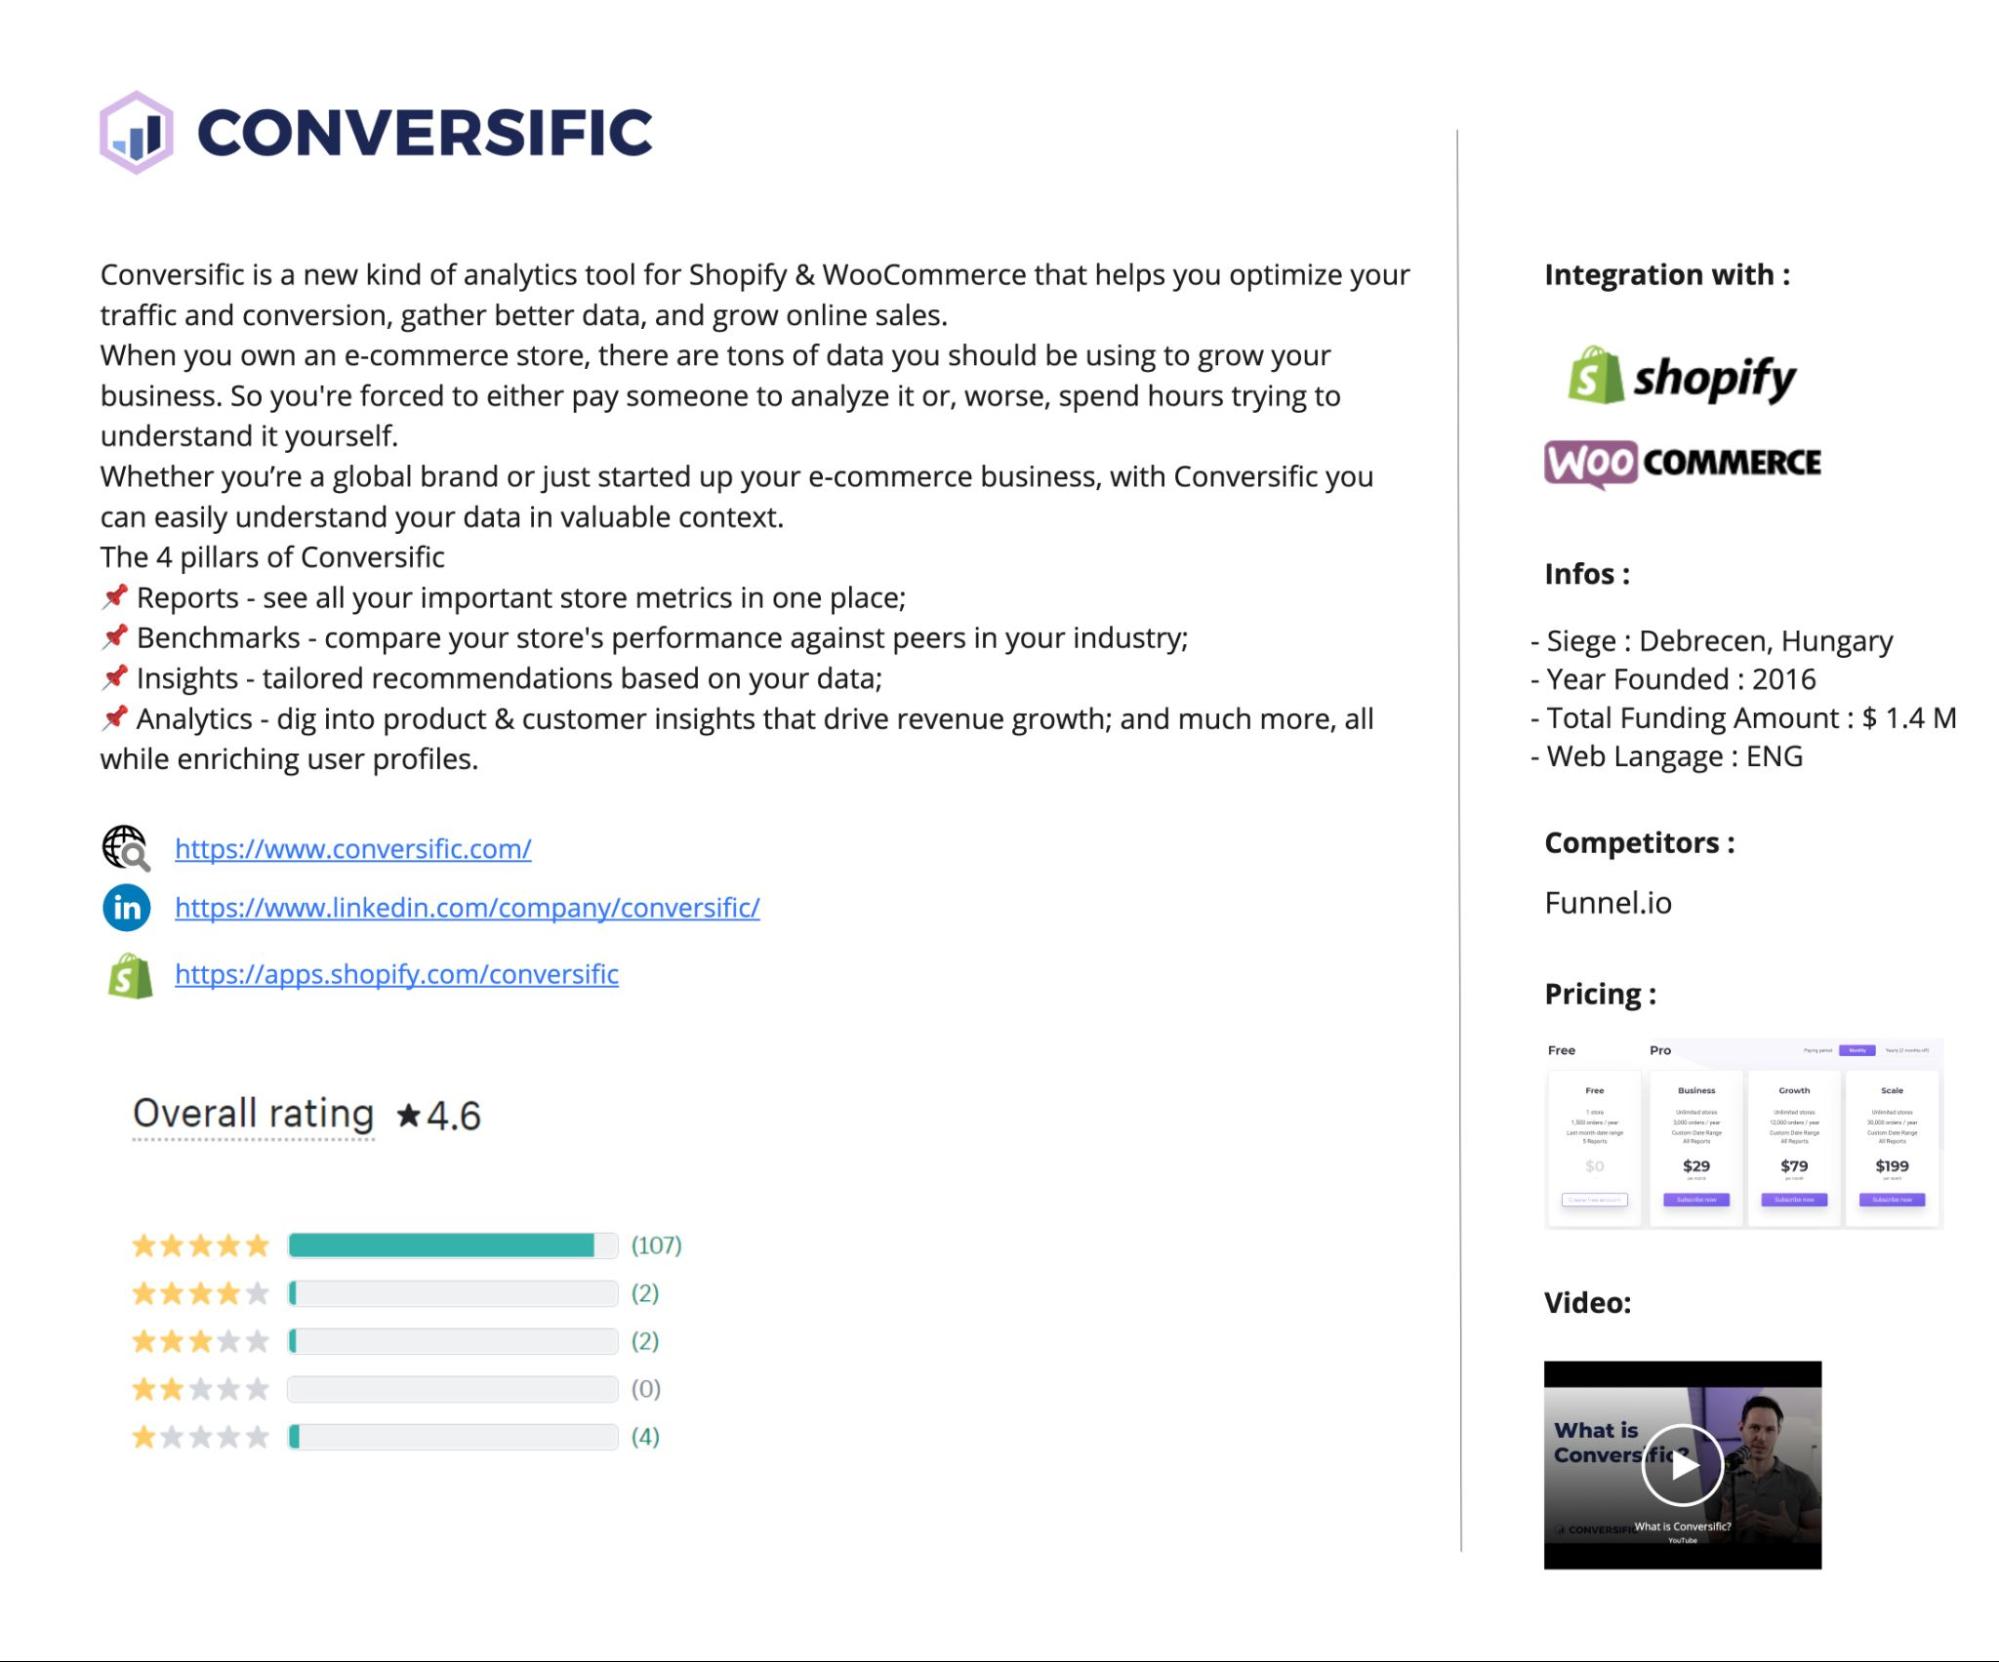
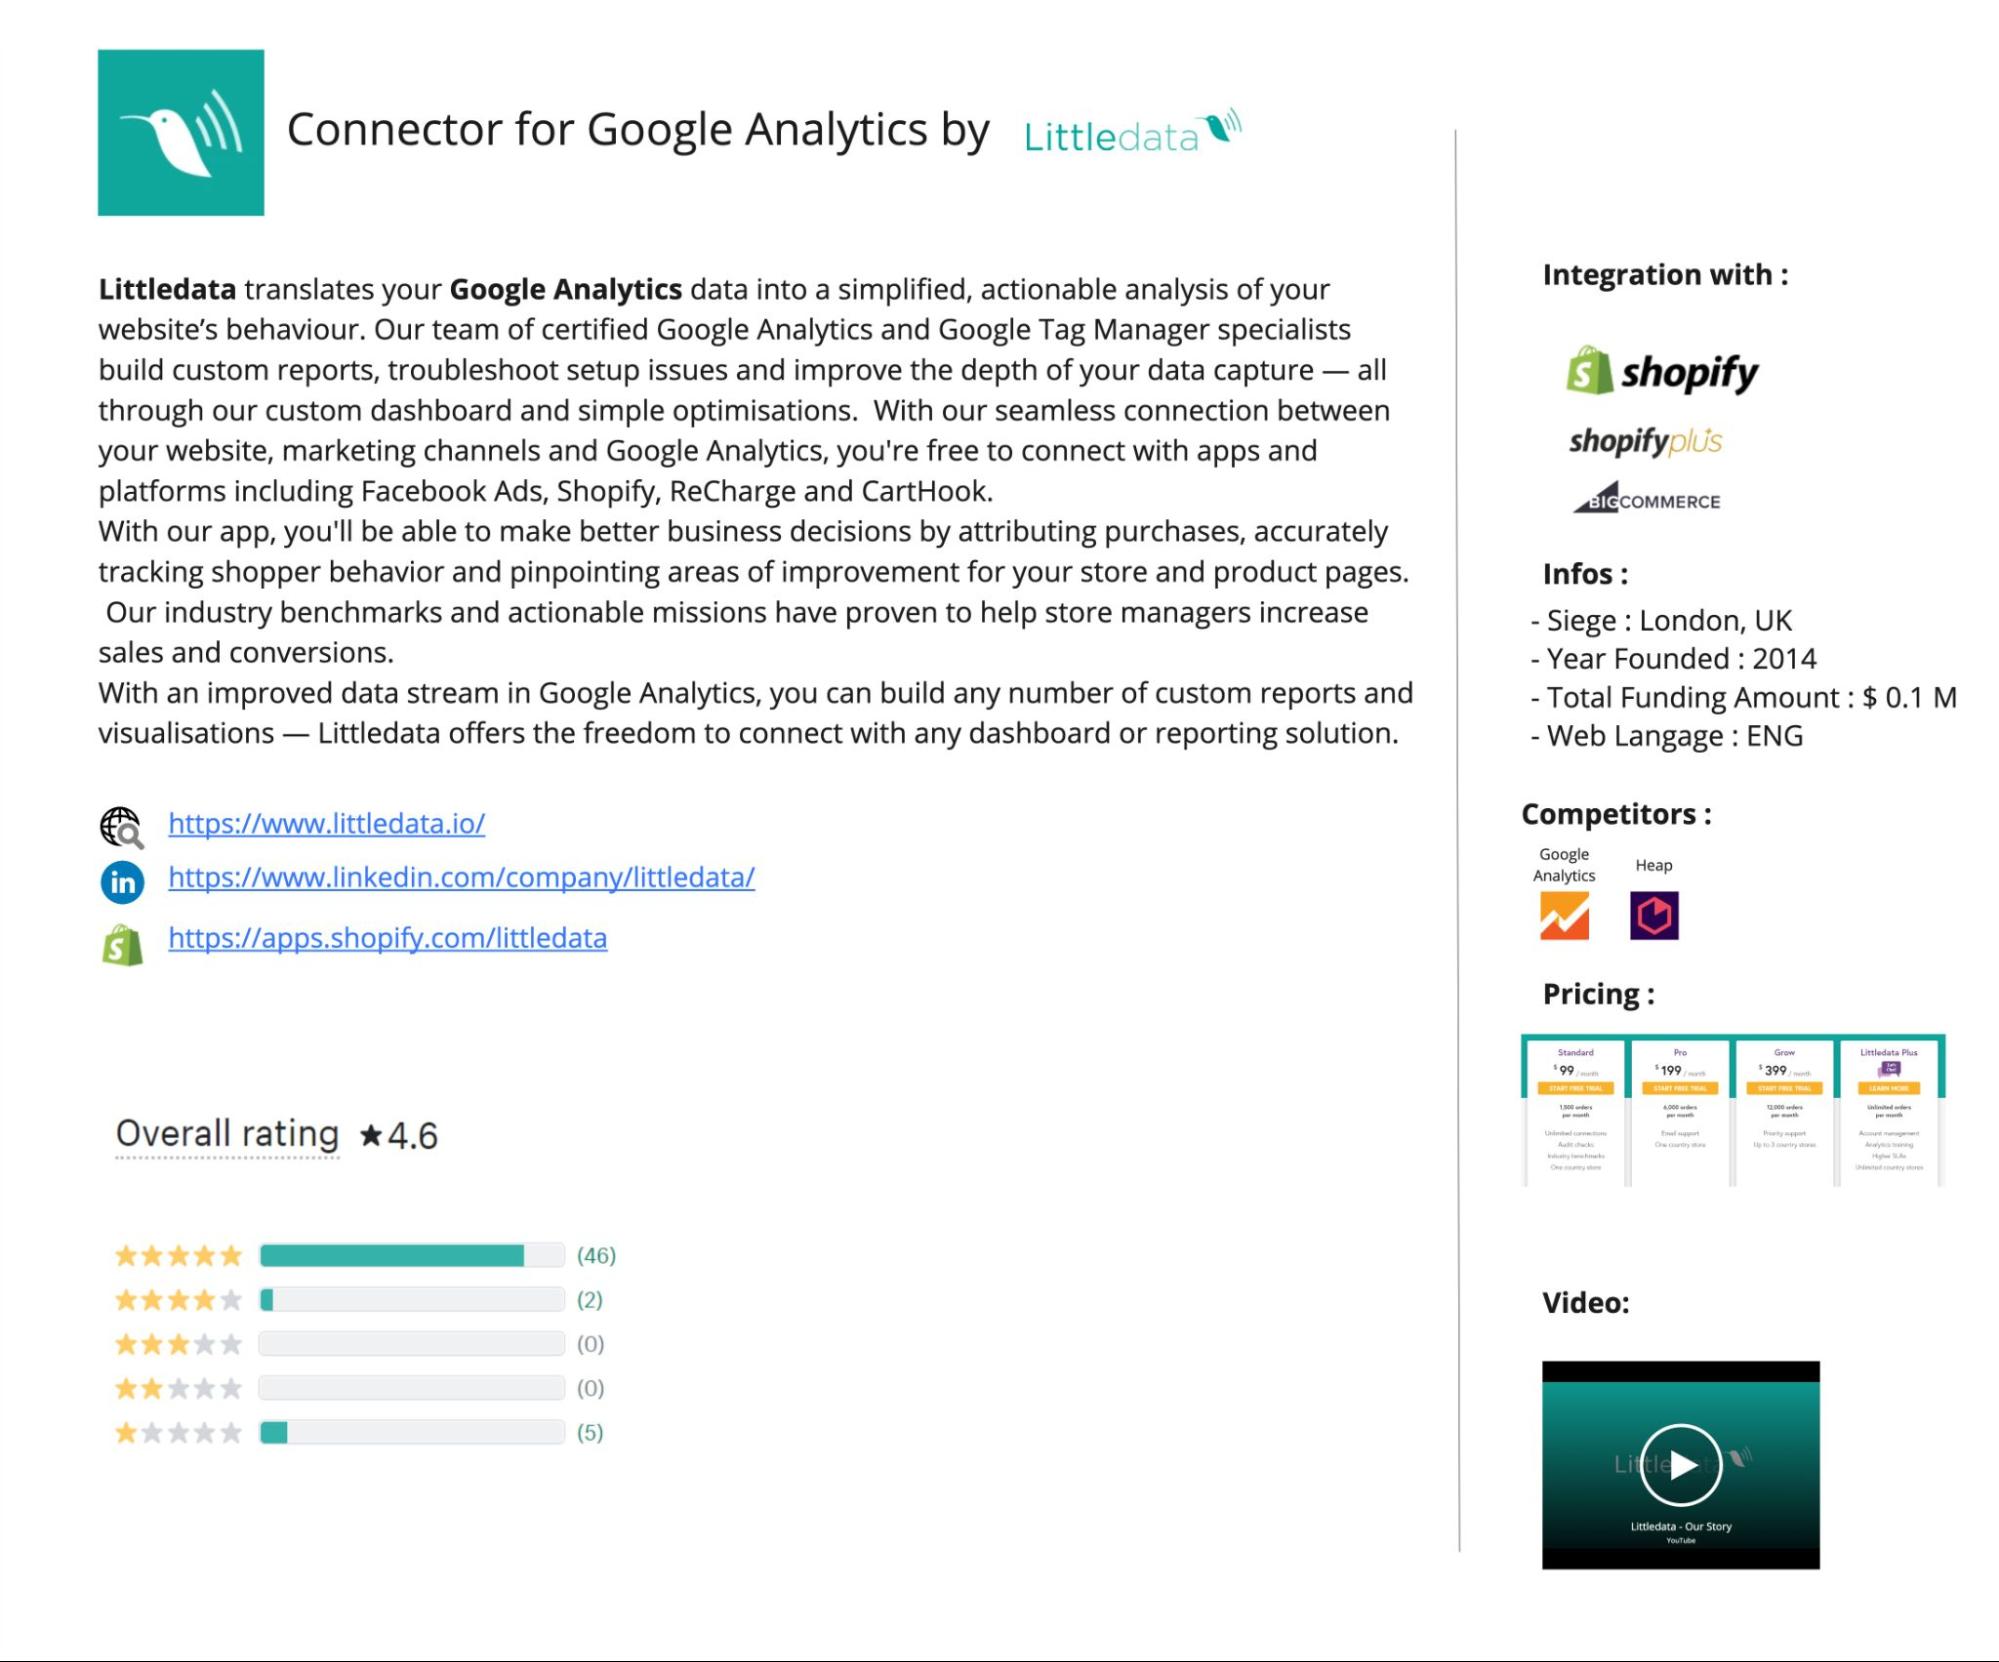
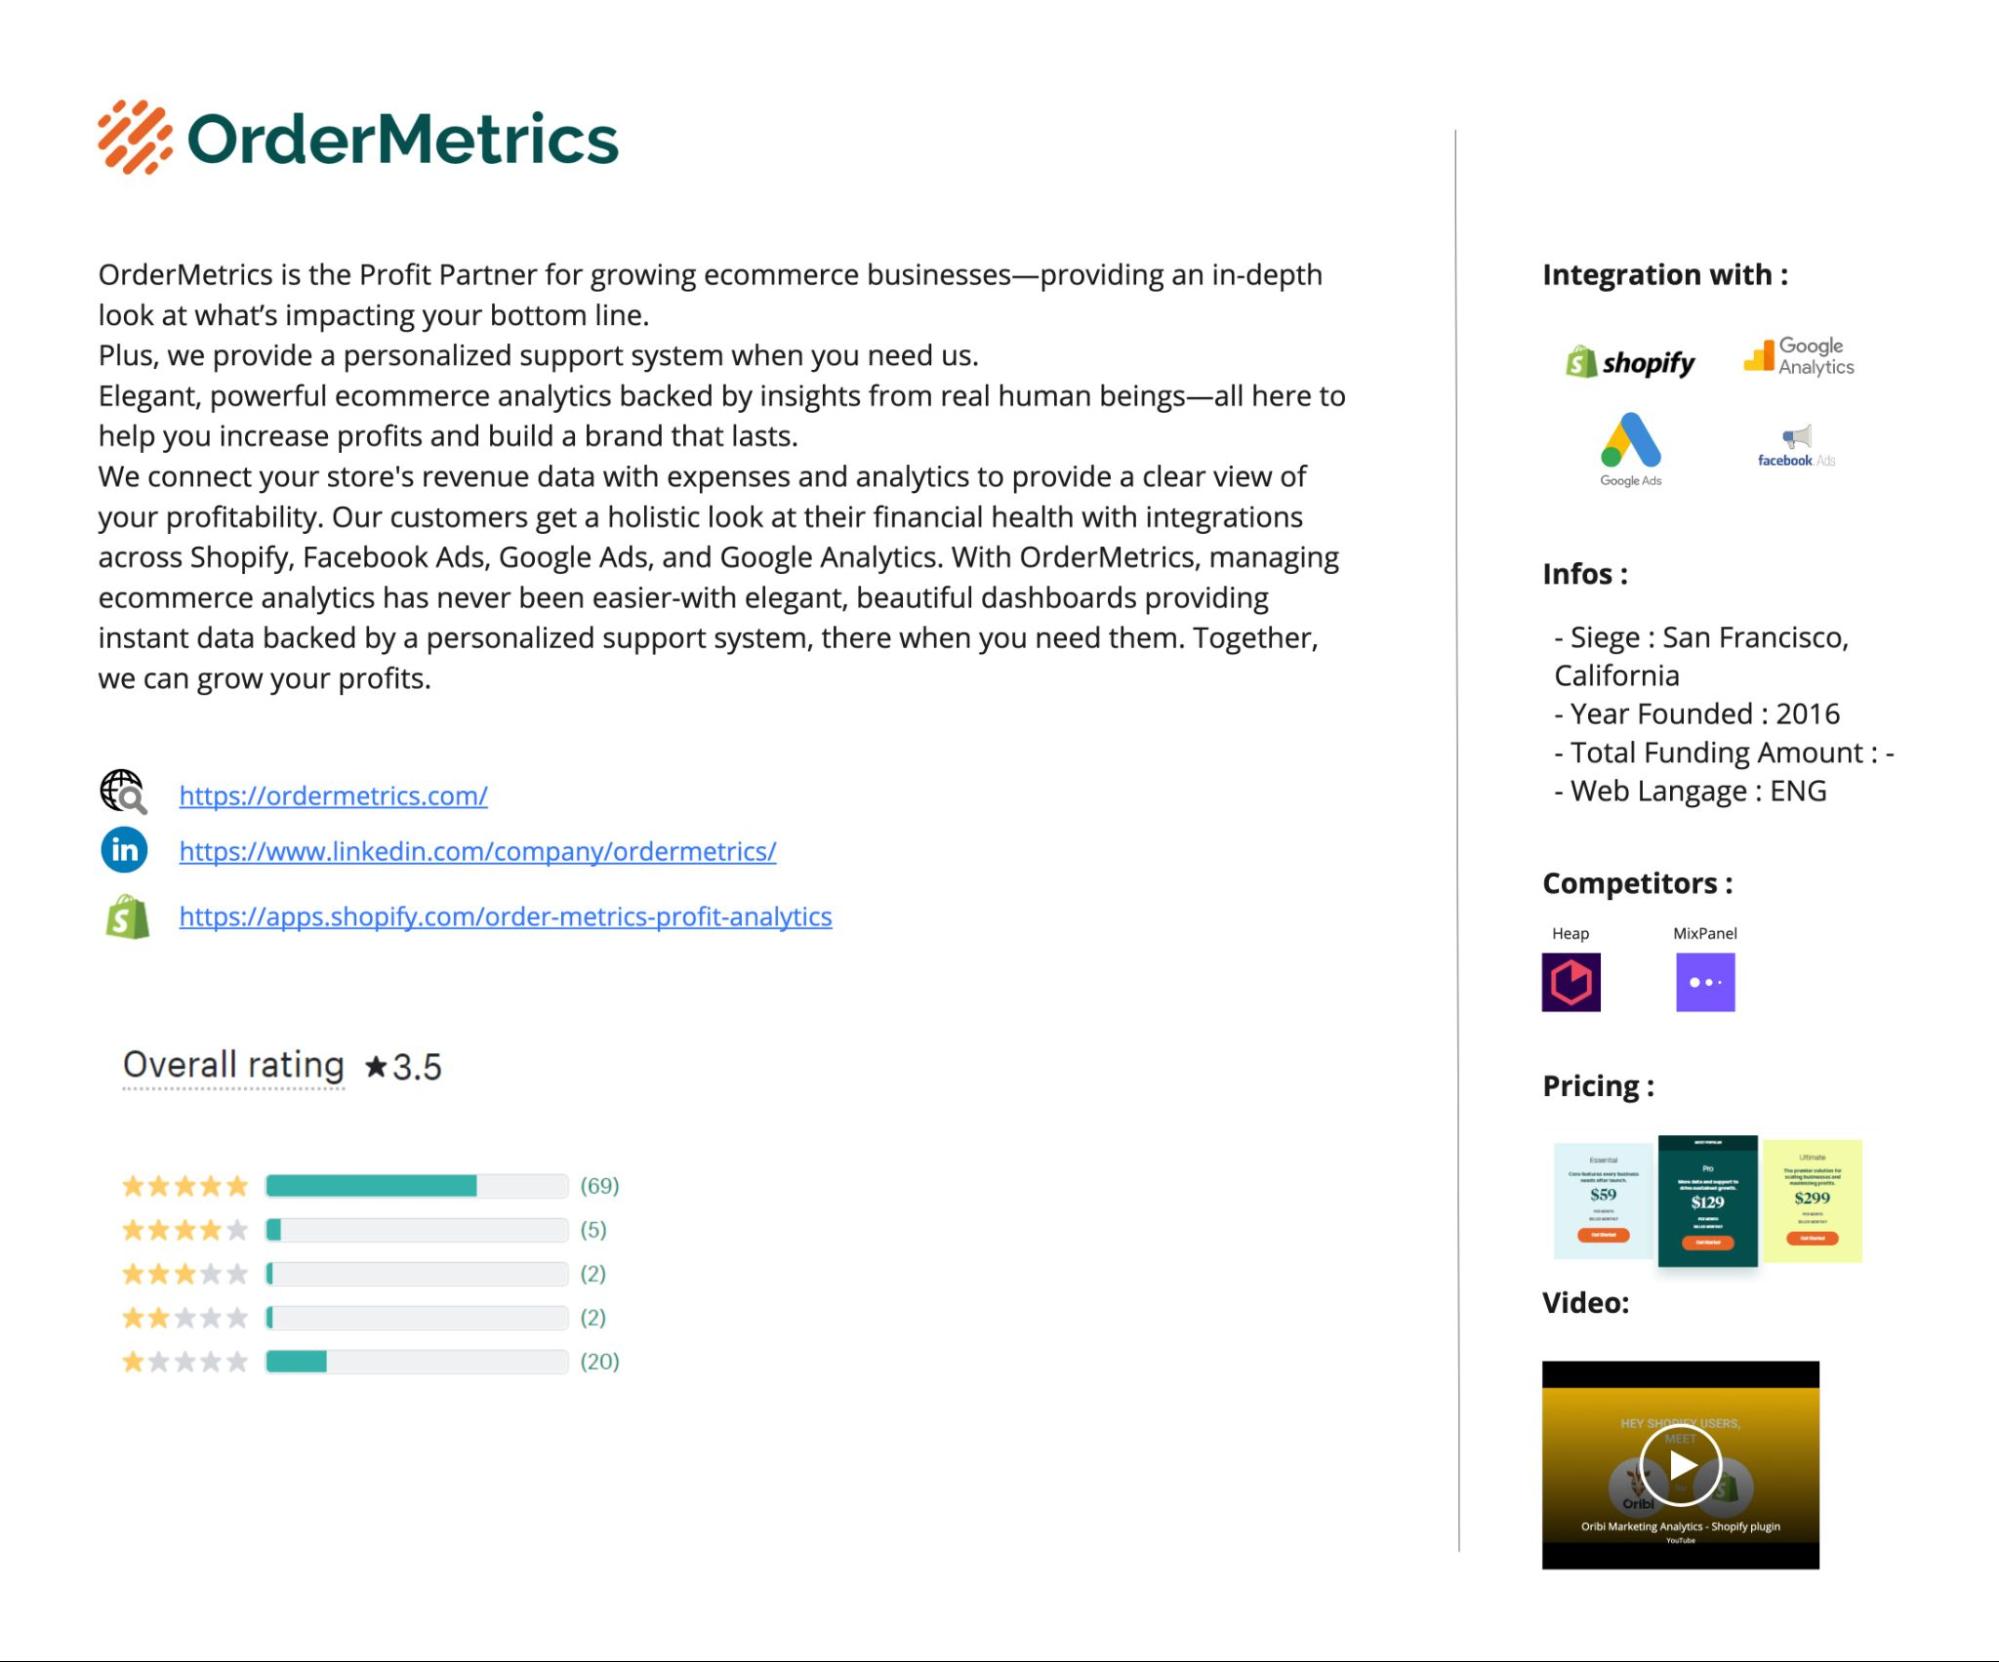
I also compared features between competitors to deeply understand their strengths and weaknesses:

As we can see, Google Analytics stands out from others with its customers KPIs, while Conversific provides complex KPIs about user traffic.Our product, PrestaShop Metrics, seems quite similar to Ordermetrics but with less features.
By understanding these facets of competitors’ products, it will be easier to strategically design a solution with the goal of making a superior product and experience.
03
Interviews
I conducted interviews with potential customers to gain insight into their perspective, pain points, purchasing habits, and so forth.
Interviews also generate empathy between the customer and the entrepreneur to aid the design and ideation process.
It provided us confirmation about the target customers and a deep understanding of user behaviors and needs.
I prepared questions that do not talk about the product to introduce and remove the emotional bias.
Example of questions: What metrics do you inspect? Can you show me? Once you see them, what do you tell yourself? How do you tell yourself you’re on track / not on track?
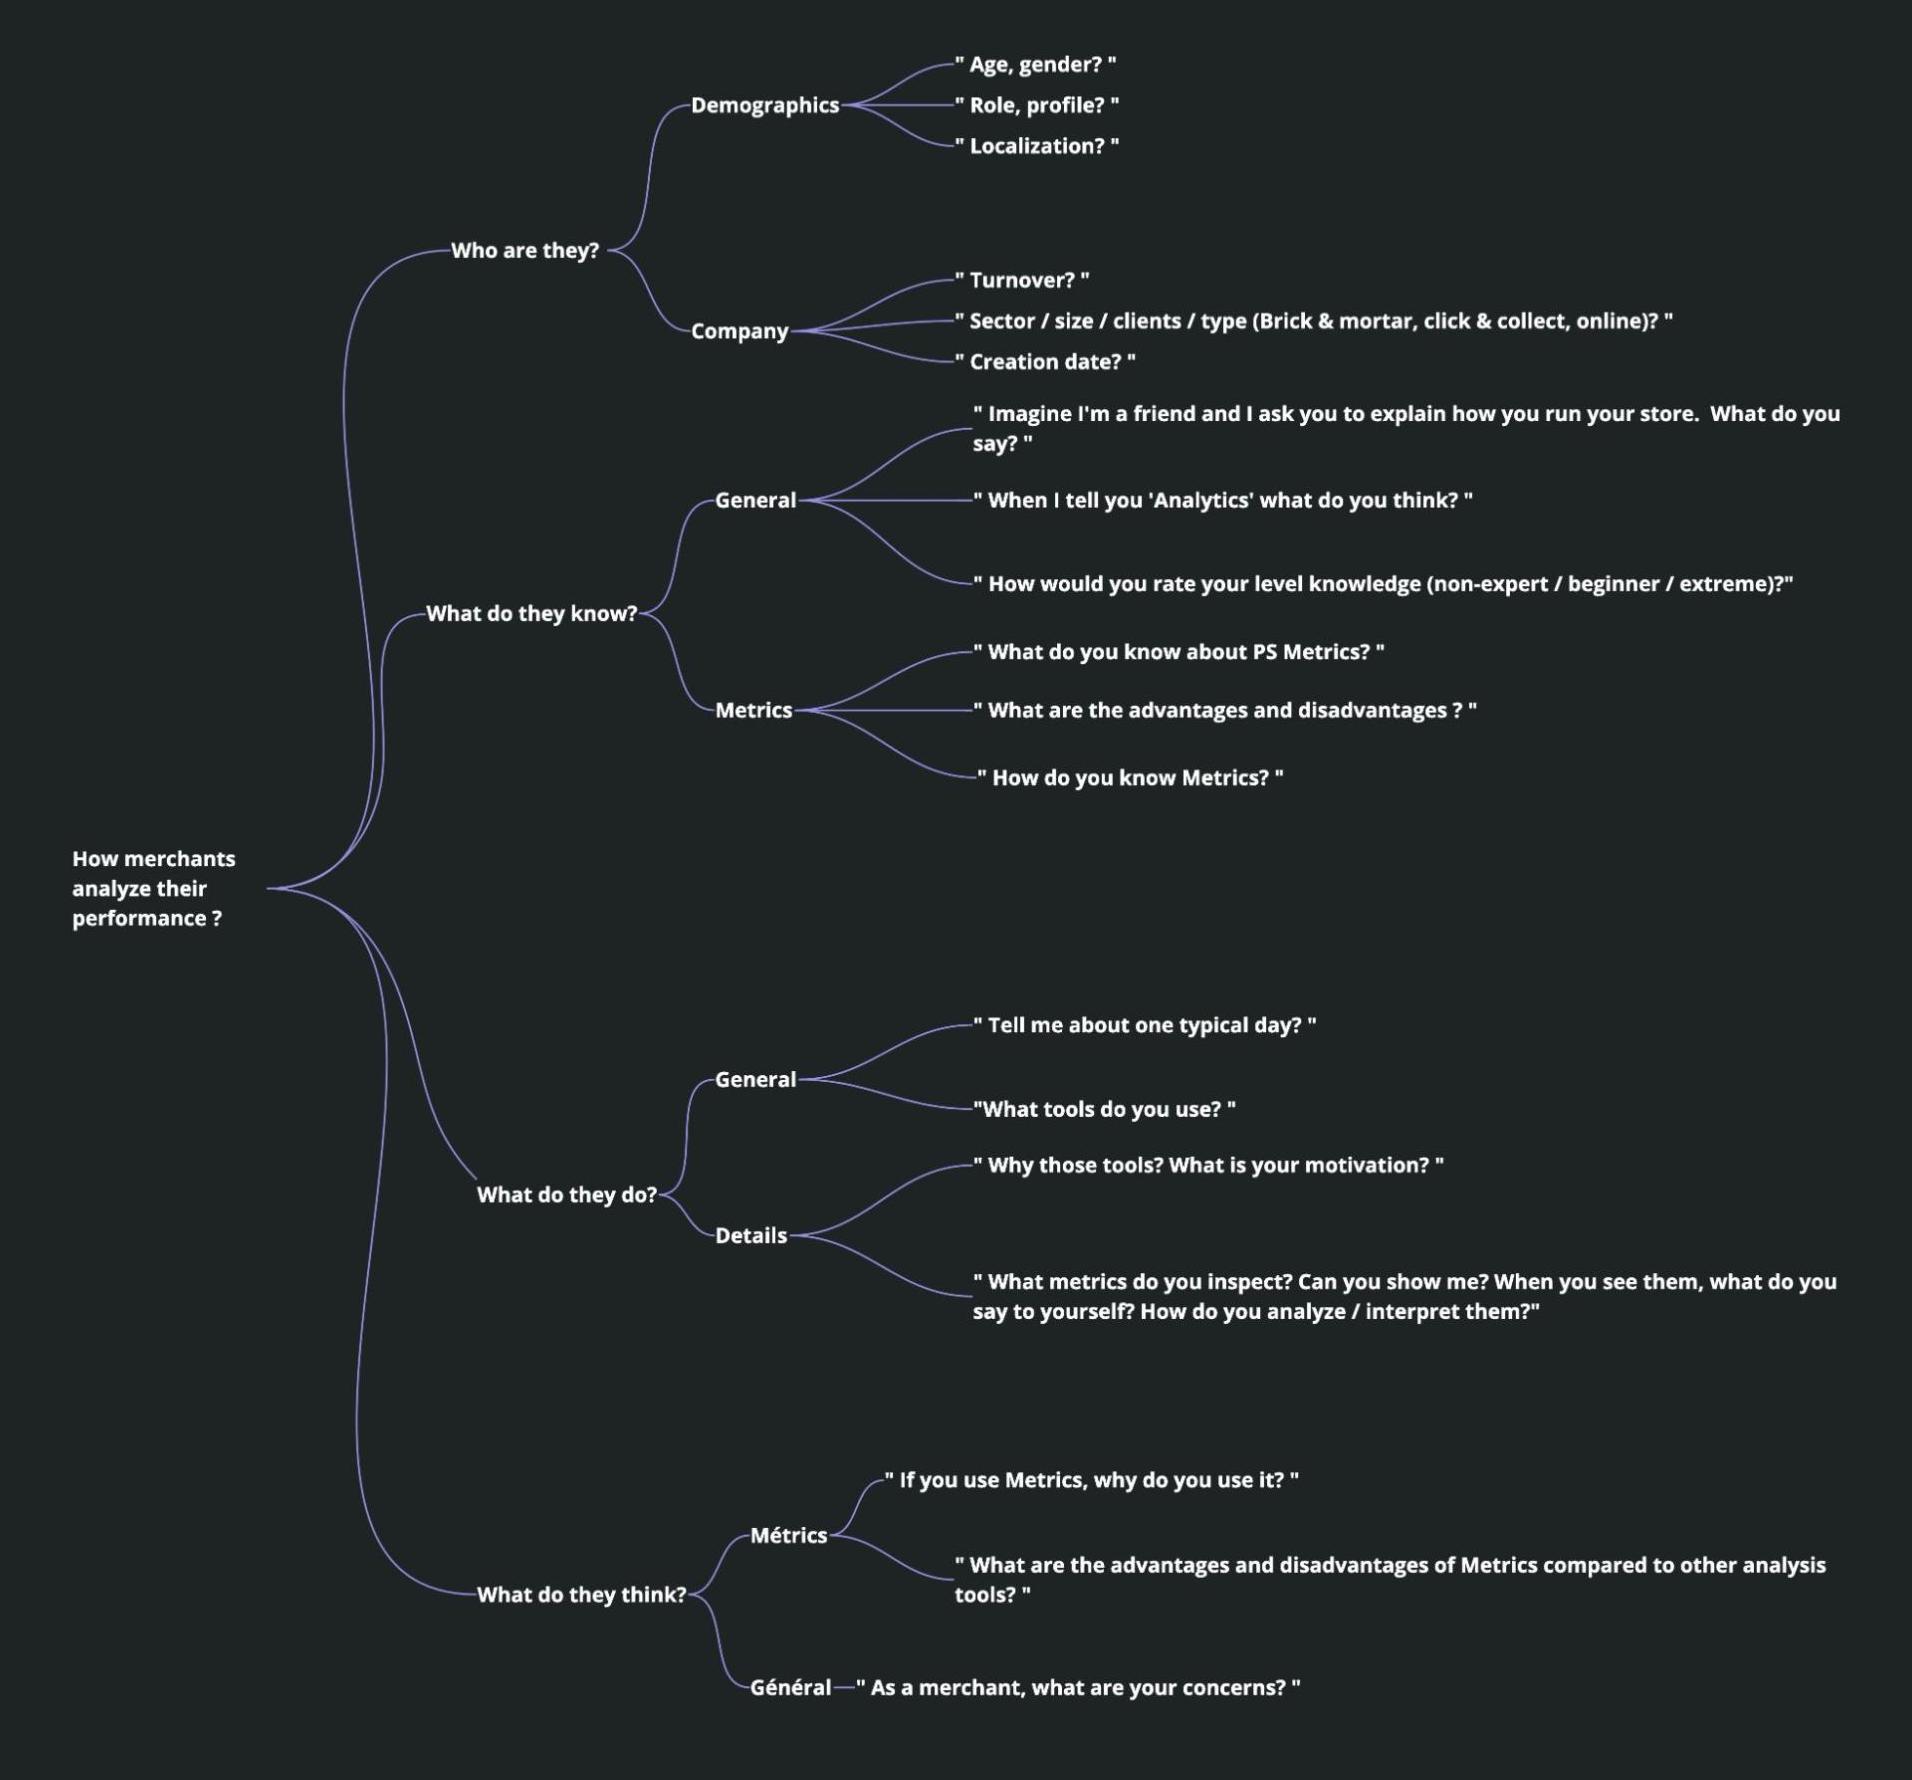
Then, I consolidated a list of users from PrestaShop “Product day”, MixPanel, the User club, Hotjar and Typeform. Starting from a qualified client base helped me a lot as I had a 30% response rate and I led 15 interviews.
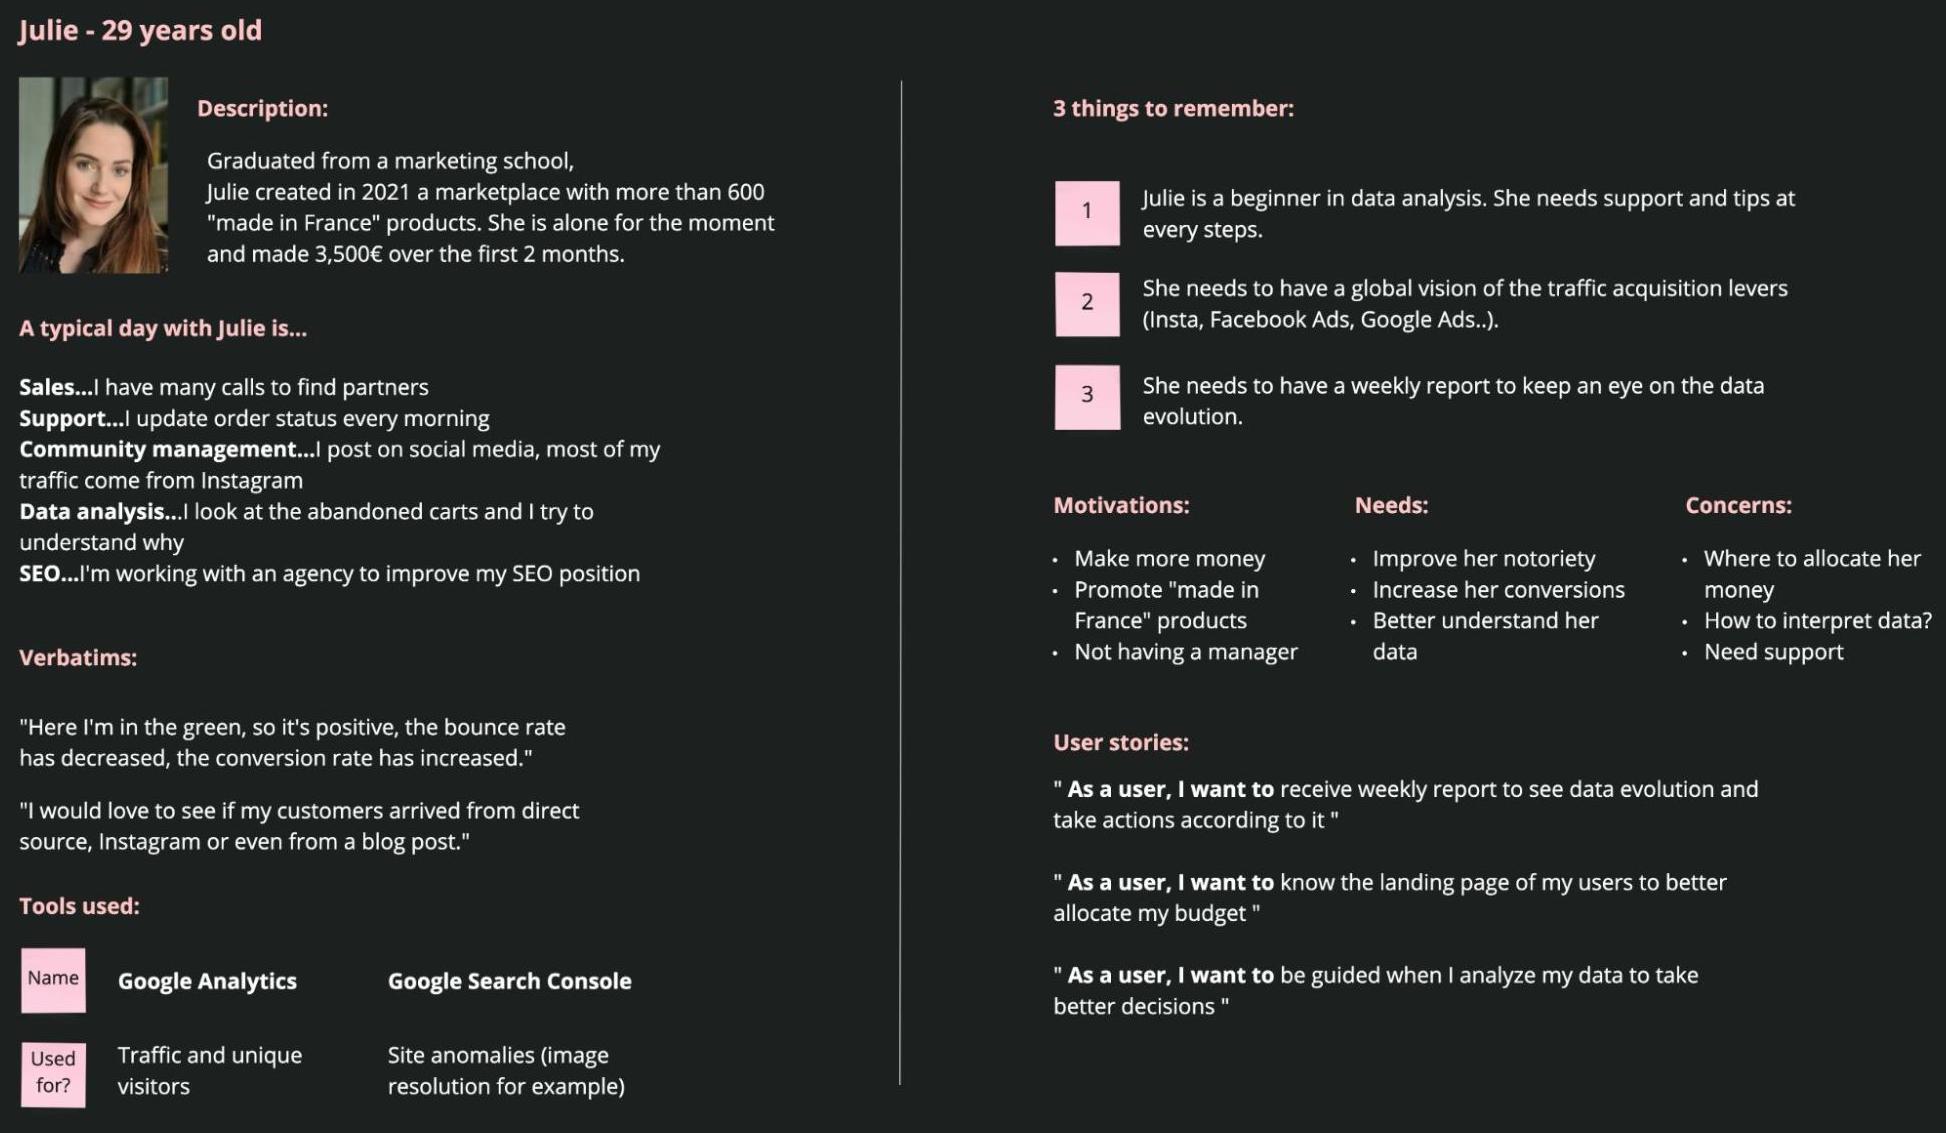
Here is an interview example:
I also spent a day at a merchant company to observe how he works and discuss his behaviors, motivations and concerns. We have configured PrestaShop Metrics together and we planned to do a follow-up every month to follow him throughout his usage.
But, I didn’t stop there :) I participated to a conference with the user club, I went to the Paris retail week to give a talk on PrestaShop Metrics and its potential evolution and I went to the Product day to collect as much feedback as I could.
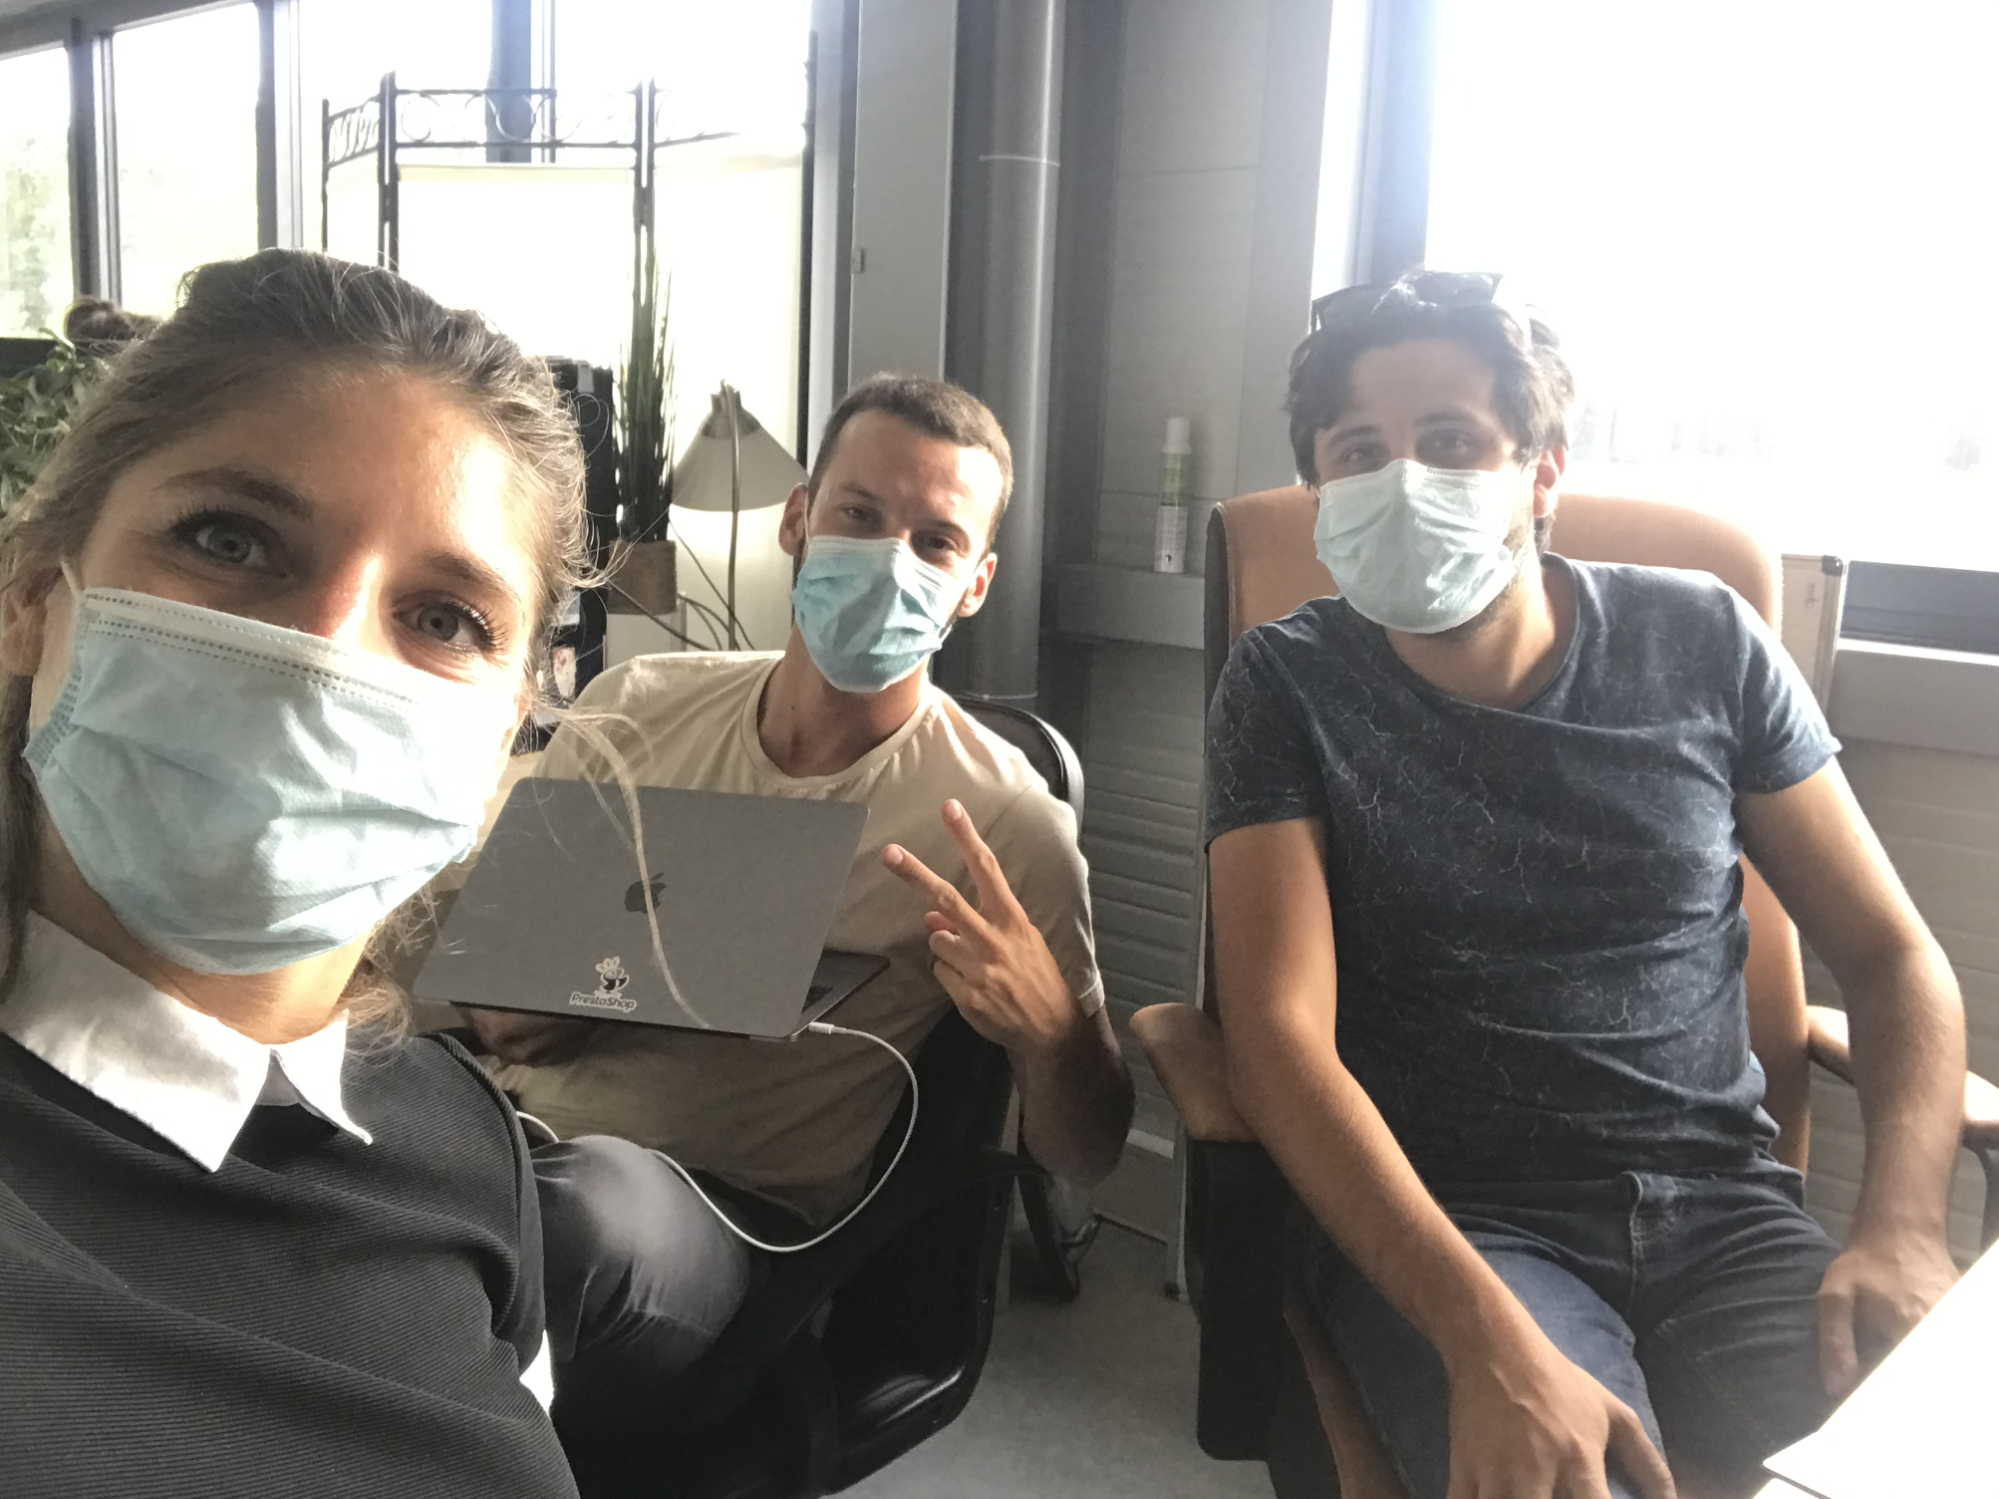
Interviews Maxime - BIVEA
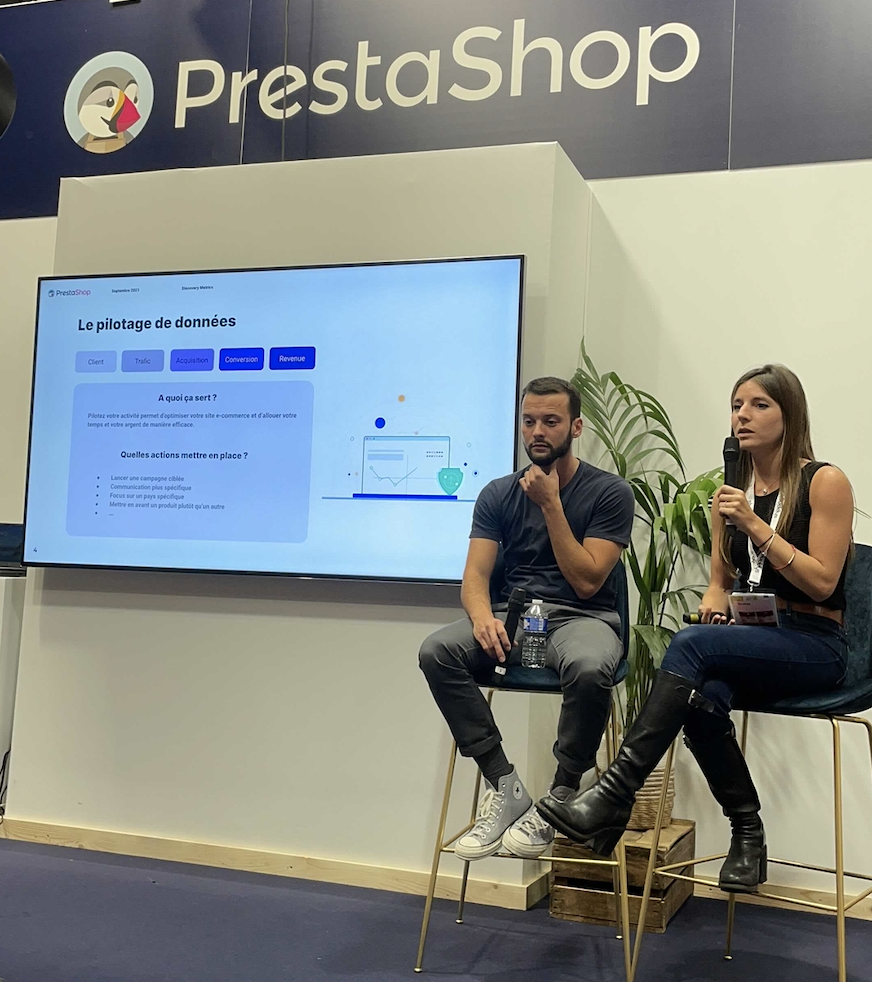
Paris Retail Week - Talk
Every week, I talked to users, I understood their pain points and I tried to catch the REAL need by just spending time with them and listening carefully.
To confirm all the insights gathered during qualitative interviews, I sent a ‘Maze’ test massively to merchants. It helped me to confirm the true value of features from qualitative interviews.
Sample of the ‘Maze’ sent:
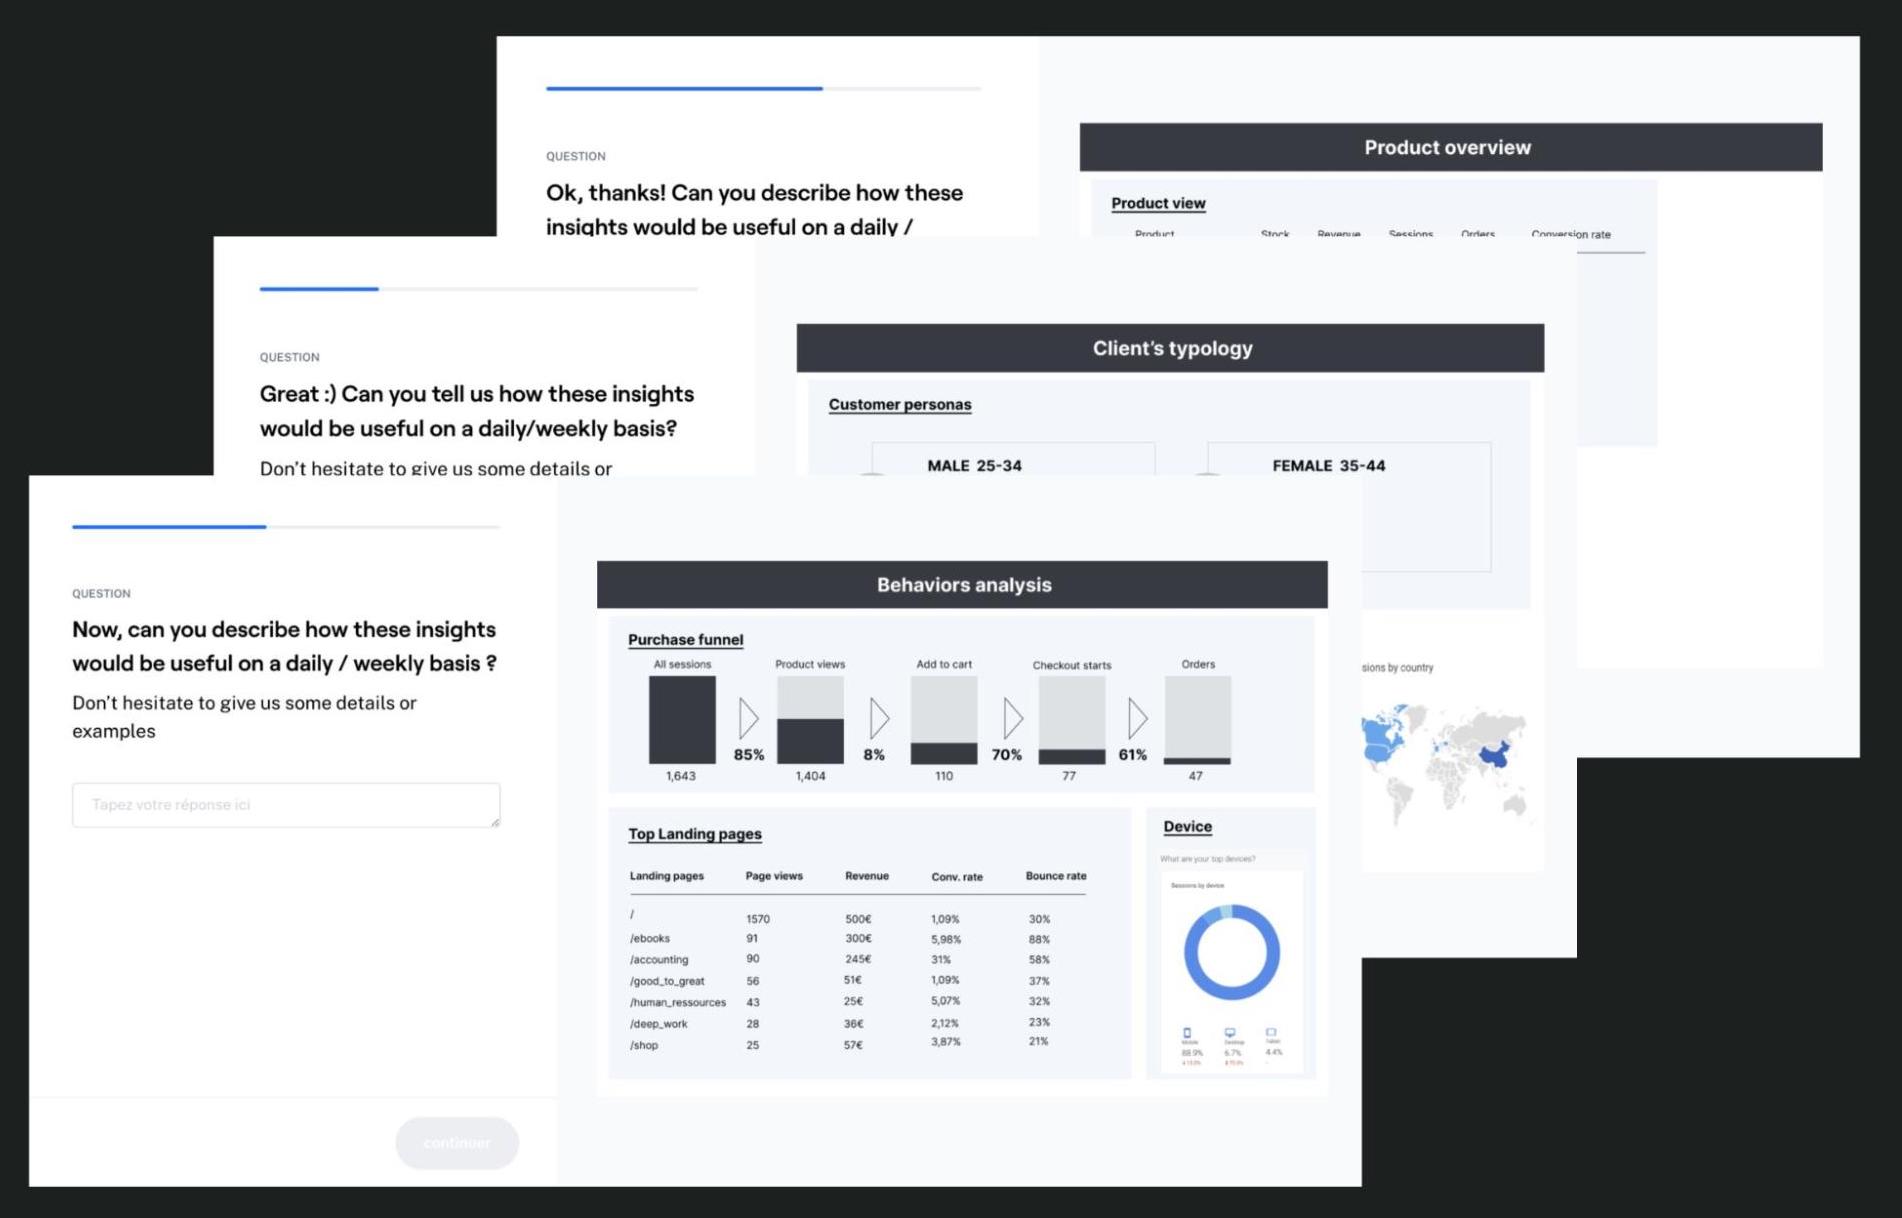
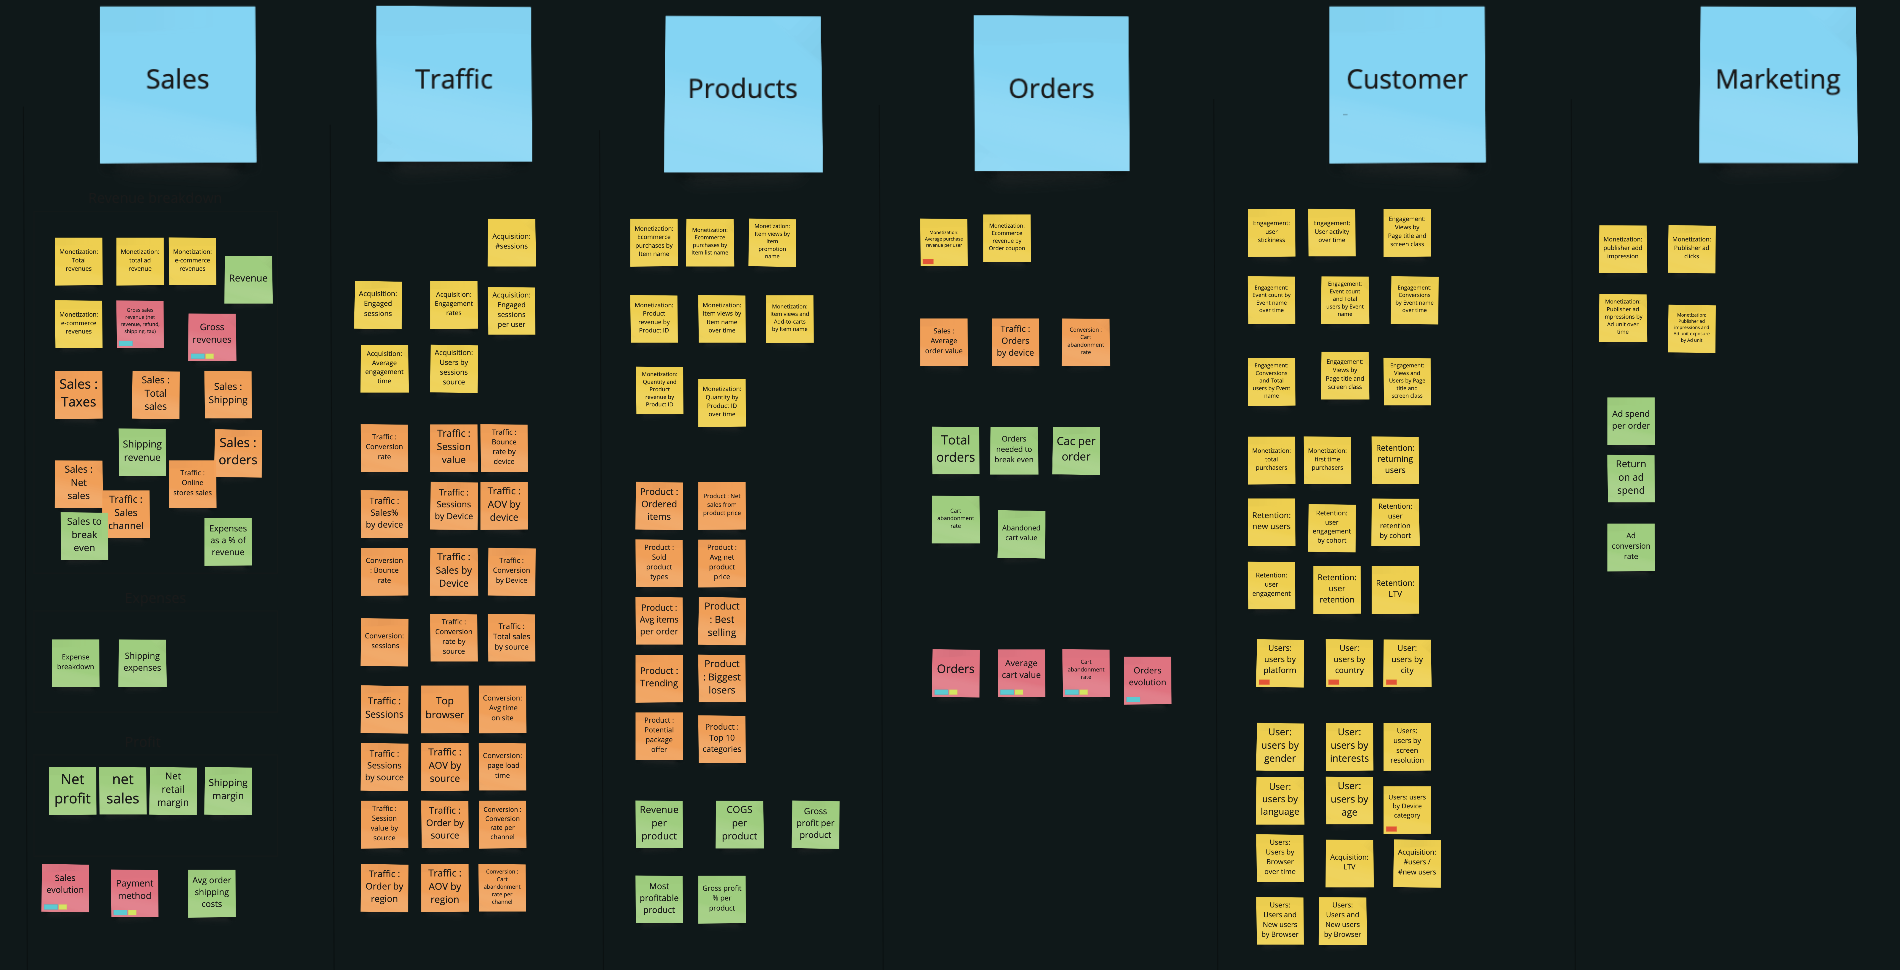
Then, I synthesized all the interviews by counting the occurrences.
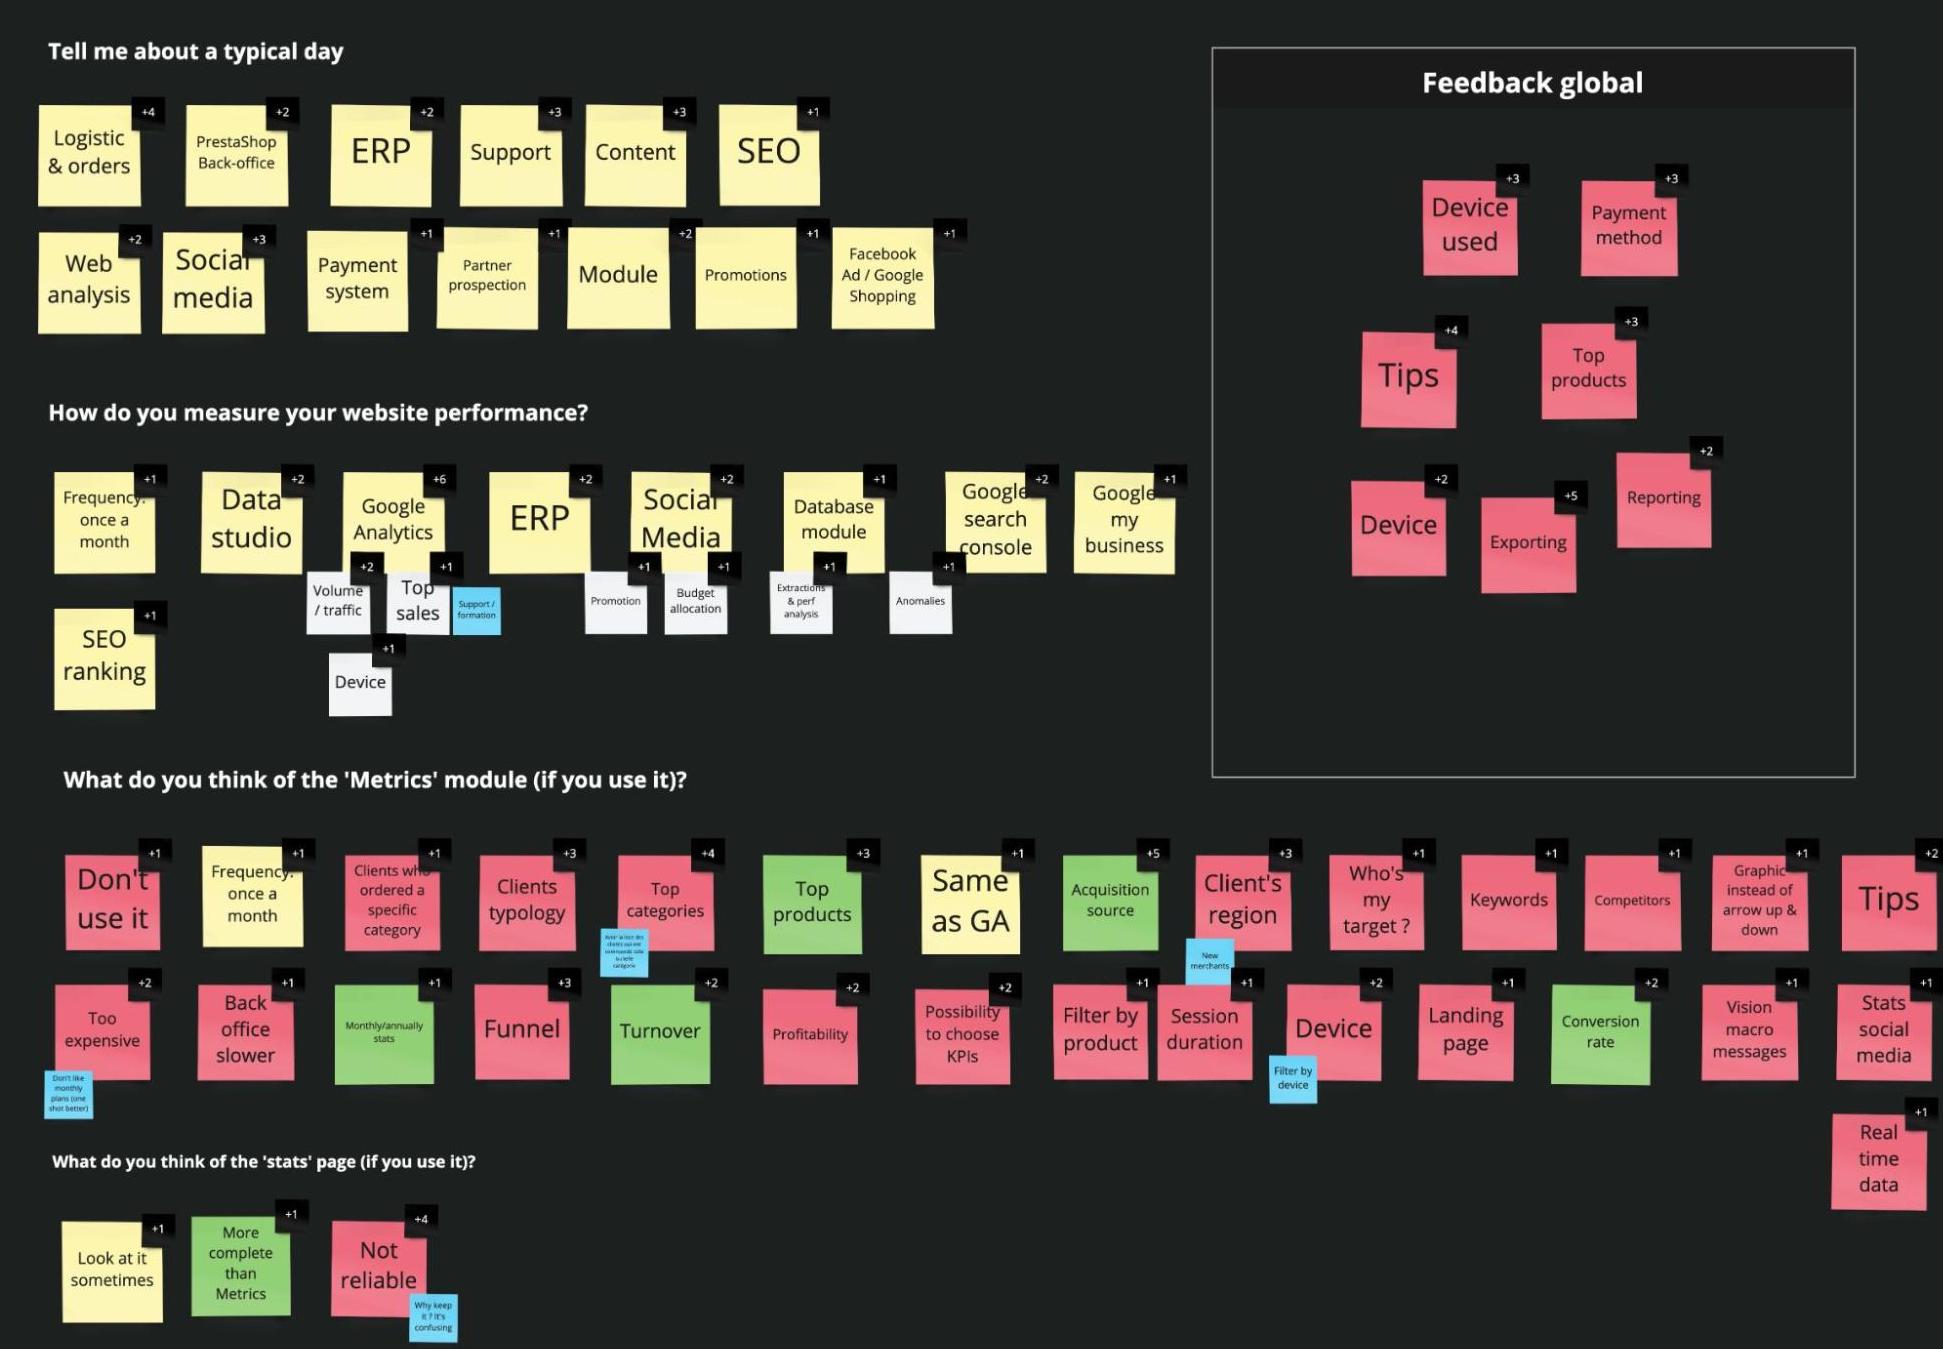
I highlighted the cards with the higher score and with my Product Manager we wrote ‘jobs’ using the ‘Jobs to be done’ method.
04
Jobs to be done / Personae
The “jobs-to-be-done” framework can help in capturing user needs and translating these into opportunities and solutions.
The whole point behind the jobs-to-be-done framework is putting customer needs at the fore, throughout the product life cycle.
I chose an hybrid solution between persona and JTBD, explaining who are the merchants, what are their needs & frustrations, daily tasks, motivations and end goals throughout their lifecycle and not based on their demographics.
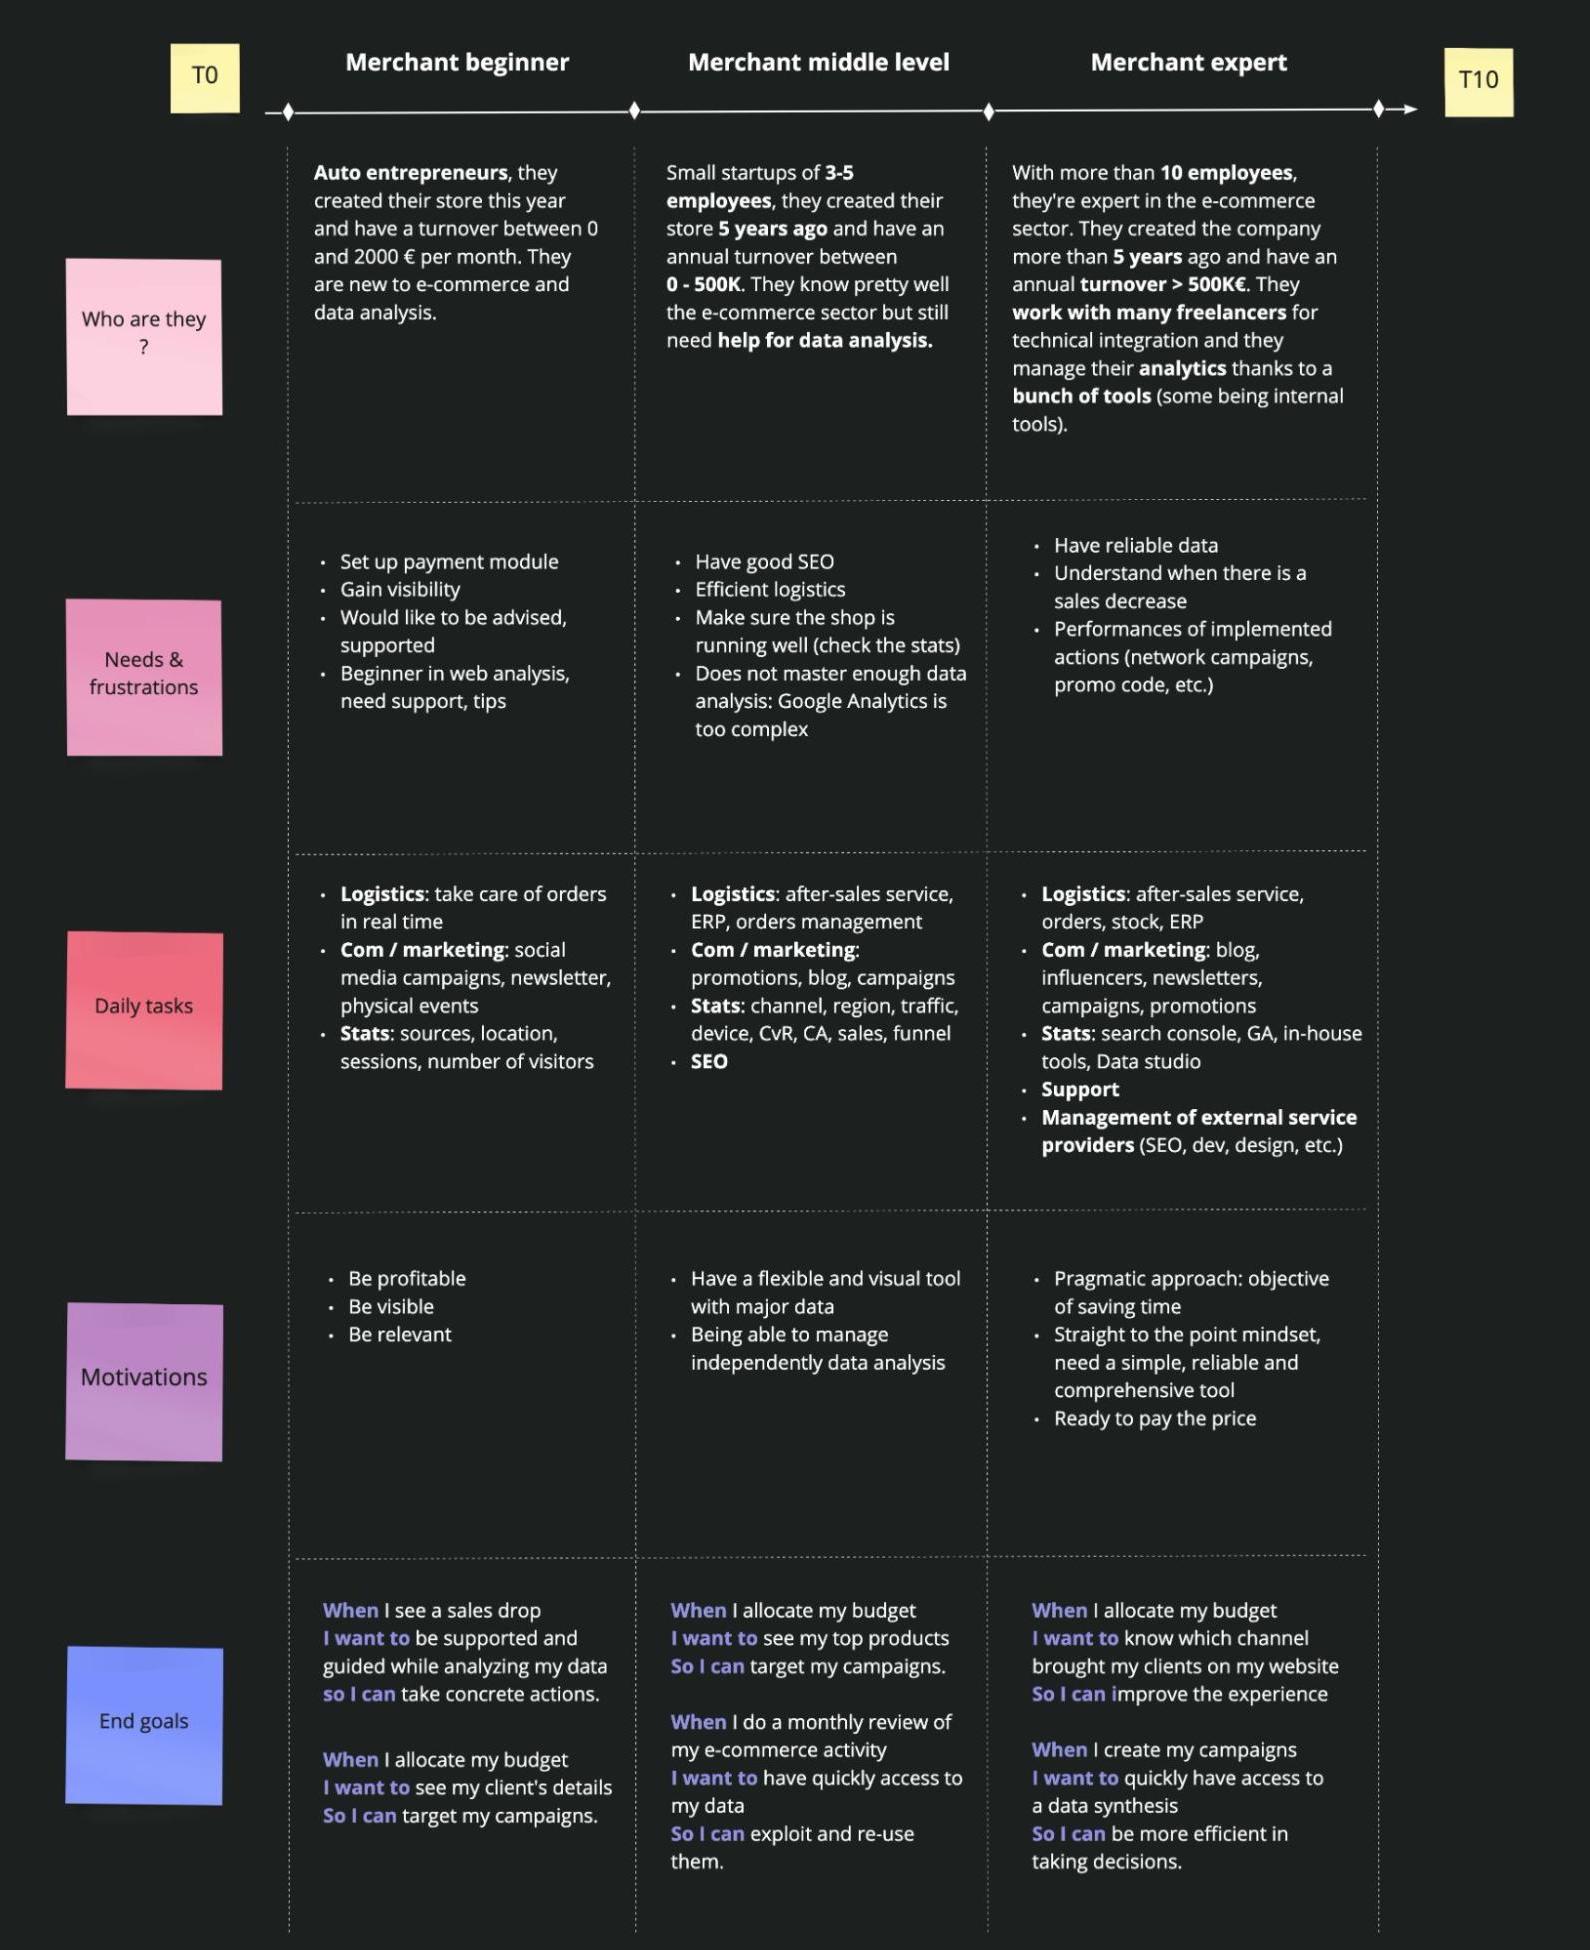
I clearly realized that merchants don’t have the same needs:
- If they just started their e-commerce activity, their primary concern is to be visible on social media to acquire their first clients. An analytics tool will be useful to target the right audience (gender, age, location) and see some data regarding sales, revenue ect ..
- If they started few years ago (less than 5 years), their primary concern is to improve the SEO. Their shop is running well and they have a solid client base. They use Google Analytics but are overwhelmed by too much information.
- For expert merchants (shop created more than 5 years ago), their primary concern is to optimize their time and automate tasks as much as possible. They work with ERP and web services and built their own in-house dashboard. Time is money and if they can save time by using a tool, they’ll do it and pay the price.
05
Prioritization Matrix
I organized a workshop with the technical teams and stakeholders to define which opportunities are in line with the following 3 dimensions:
-
Strategic alignment:
- ICP score
- Global strategy
-
Added value:
- Business value
- Usability value
- Internal value
- Technical value
-
Technical implementation & risks:
- Dependencies and risks
- Technical complexity
Below is a sample of the Prioritization matrix:
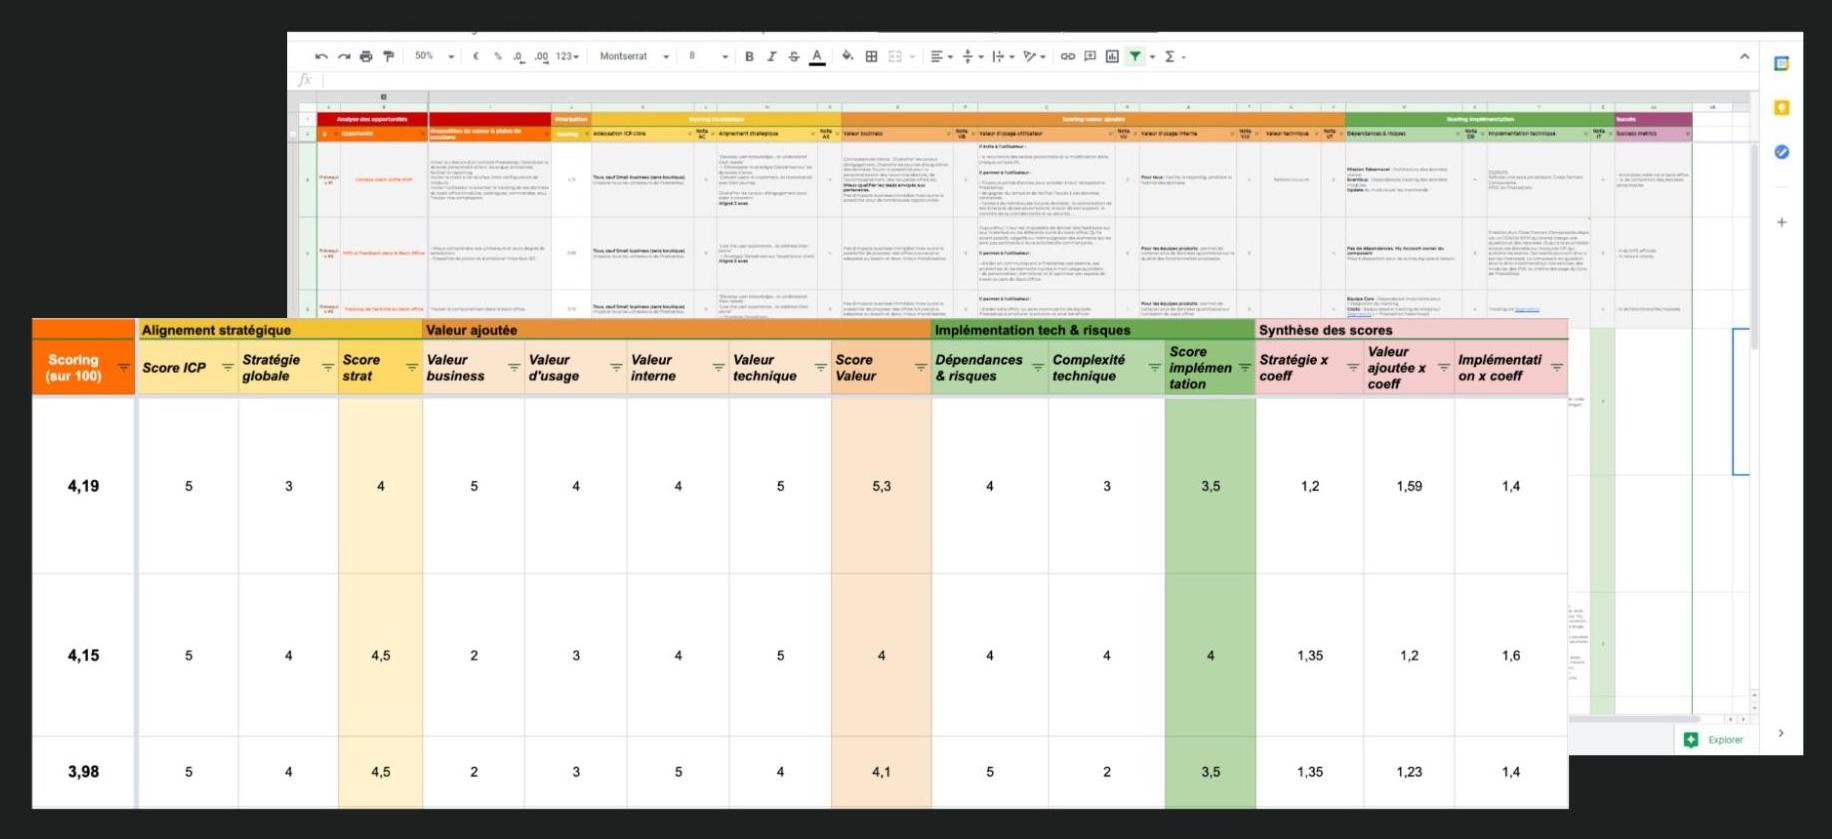
It helped us prioritize opportunities and provide a list of new features to the team.
Below is a sample of the feature list:
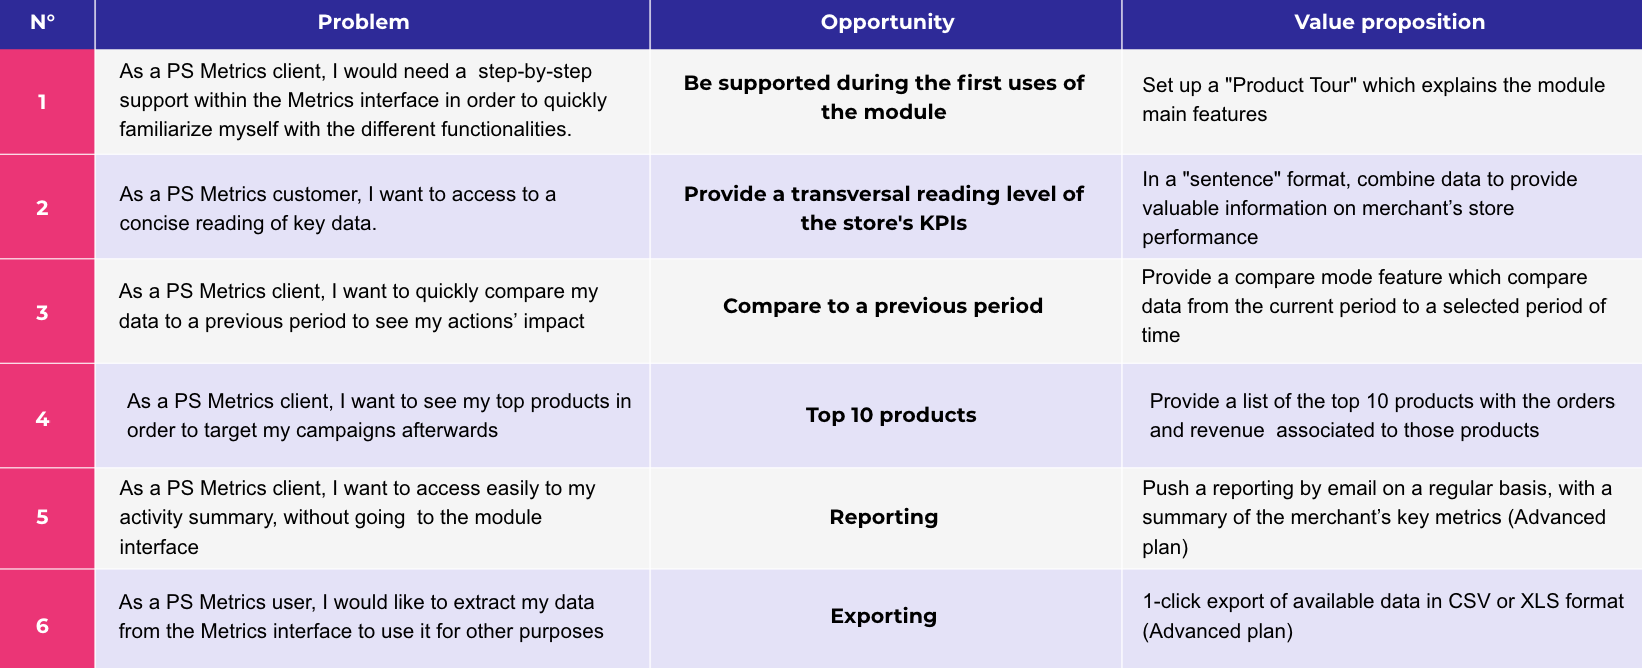
Now that I have a prioritized feature list, I can start the conception part.
But before adding some features, I realized after interviewing merchants that it’s important to improve the existing product.
Indeed, 100% of merchants had an issue with the tool. It could be a technical issue, a problem during the onboarding or a KPI misunderstanding.
80% of merchants didn’t even know the existence of PrestaShop Metrics. Better communication is key to acquire clients.
We’ve implemented some actions:
-
For technical issue:
- Follow-up with the support team every week
- Allocate time to developers for support tasks
-
For communication:
- Attend to events like Product Day, Million club, Paris retail week
- Work with the marketing team to communicate with the right speech
- Propose to download PrestaShop Metrics at different places in the Back-office
Then, after a presentation to the stakeholders, My Product Manager wrote user stories and I started the UI conception for the new features.
06
PrestaShop Metrics before
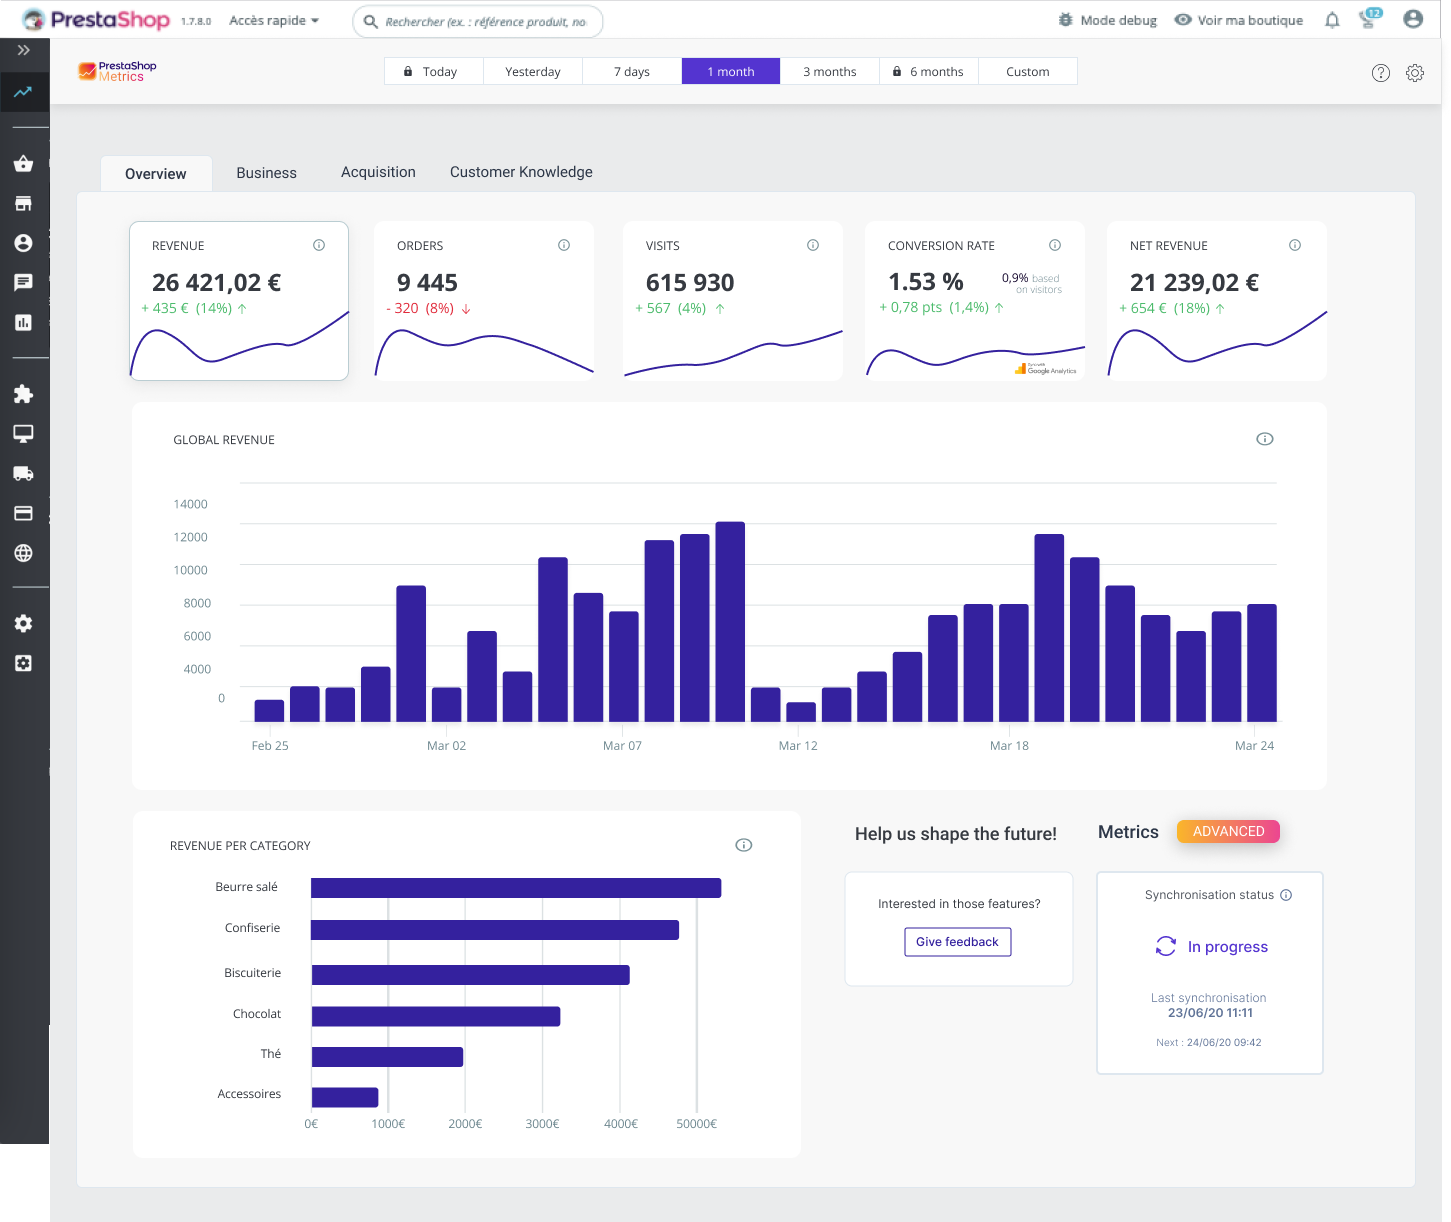
I decided to visually redesign the dashboard while adding features to it. Indeed, It’s time for PrestaShop to be ‘modern’ and accurate in terms of accessibility.
07
UI Conception
Before designing anything, I had a look at the competition (MixPanel, Google Analytics, OrderMetrics and Conversific) to inspire me for the UI conception.
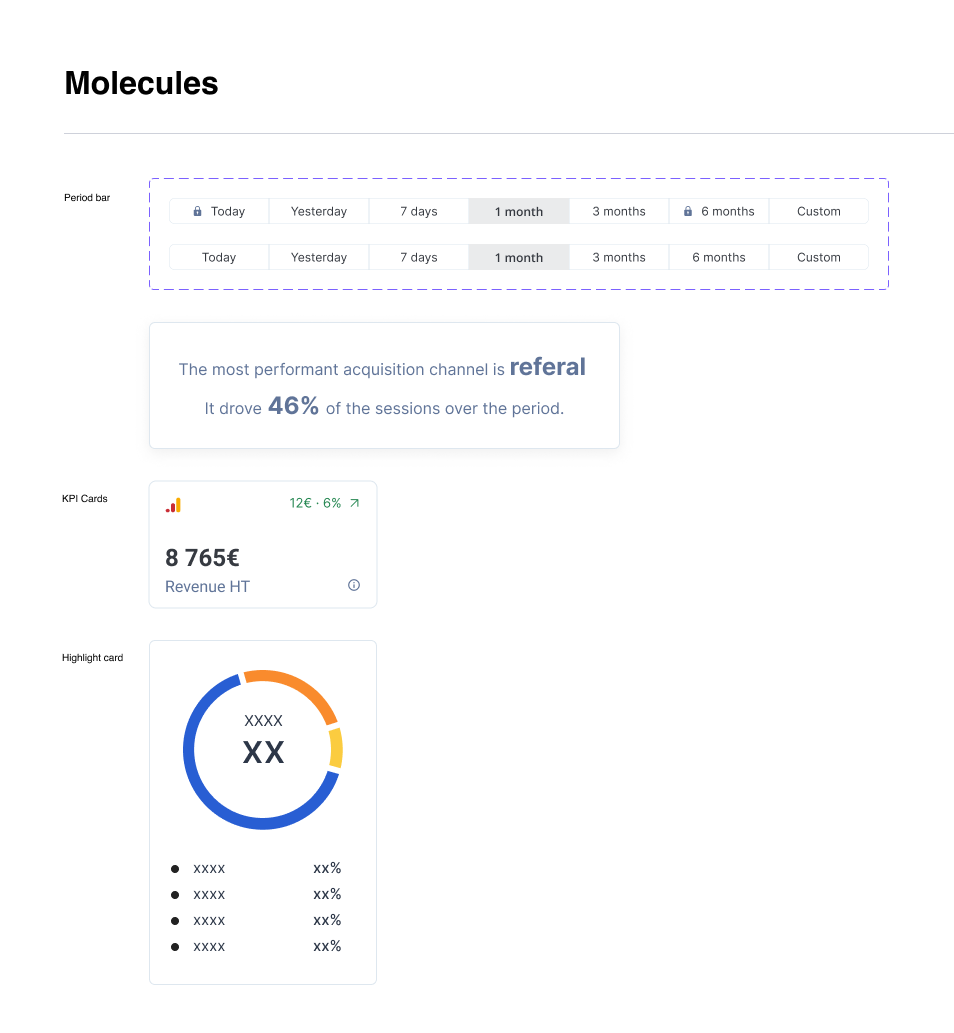
The Design System being in progress, I started by designing the components needed to create the new dashboard.
I used new colors, which are accessible, to inspire the design system to come:

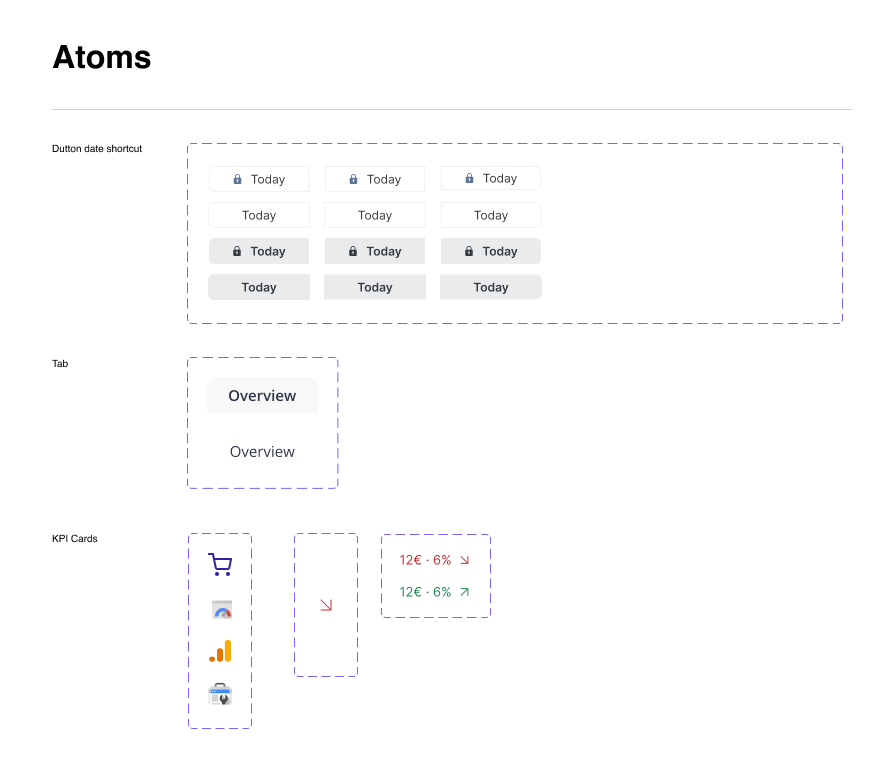
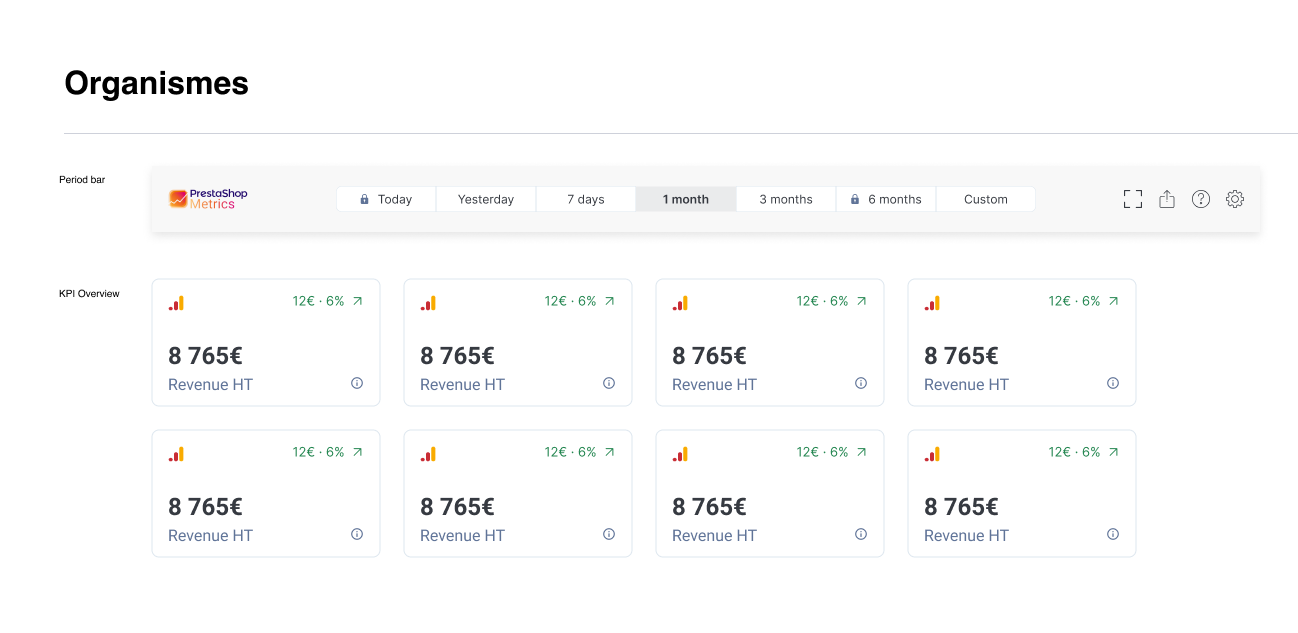
I created components by using the ‘atomic’ design method, which means starting by atoms, then molecules and finally organisms.
It’s important to design components using ‘auto layout’ and ‘variants’ with Figma. It helps for responsive design and to save time when a modification is needed.
Below is a sample of the designed components:
08
Finally: PrestaShop Metrics 2.5
After a few user tests through the tool “Maze” I designed the final mockups.
Then, I worked hand in hand with developers to deliver the new features.
The features developed for this new version are:
- Product tour
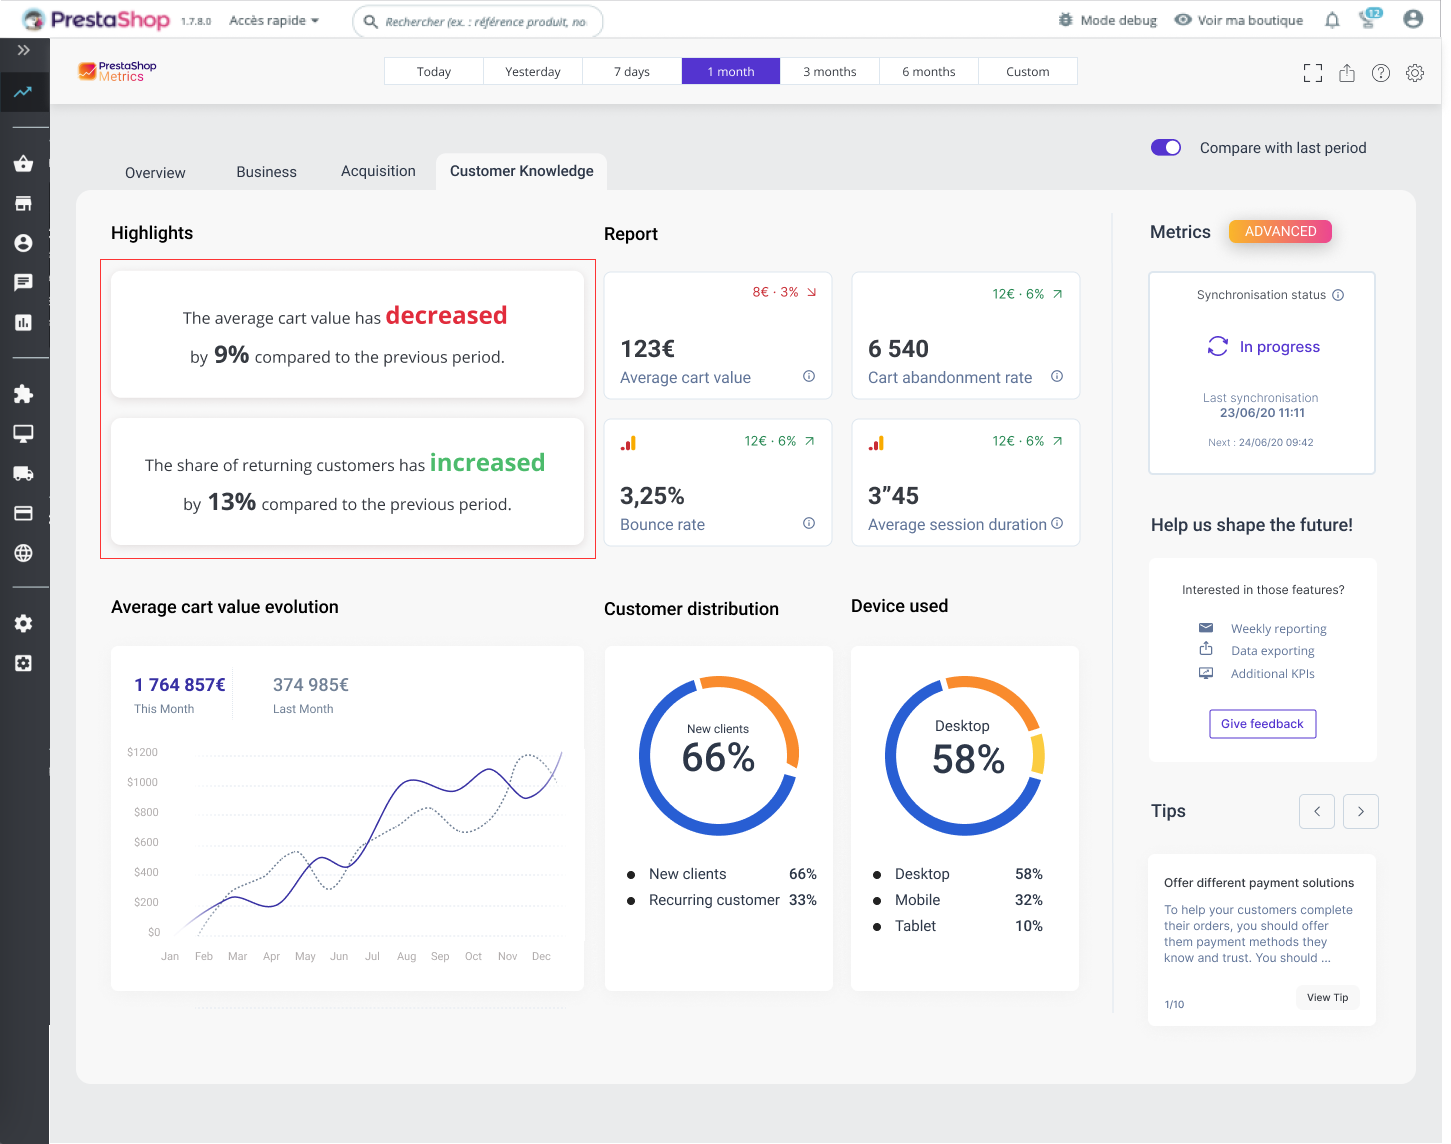
- Highlight on key data
- Compare mode
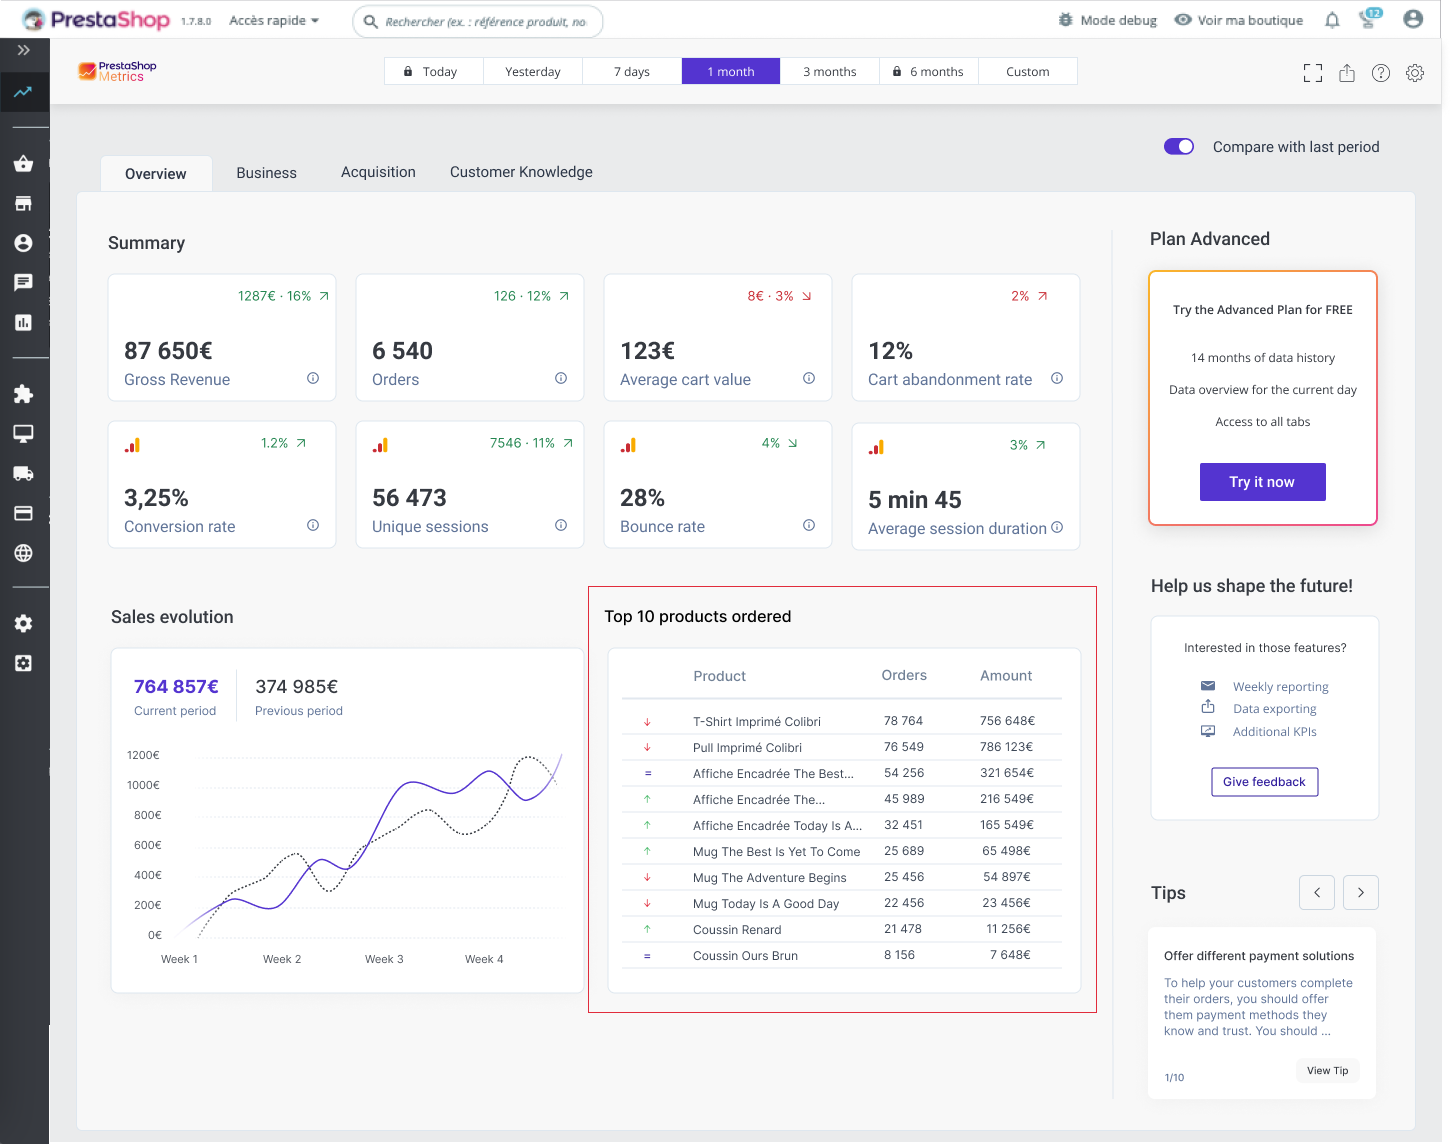
- Top 10 products
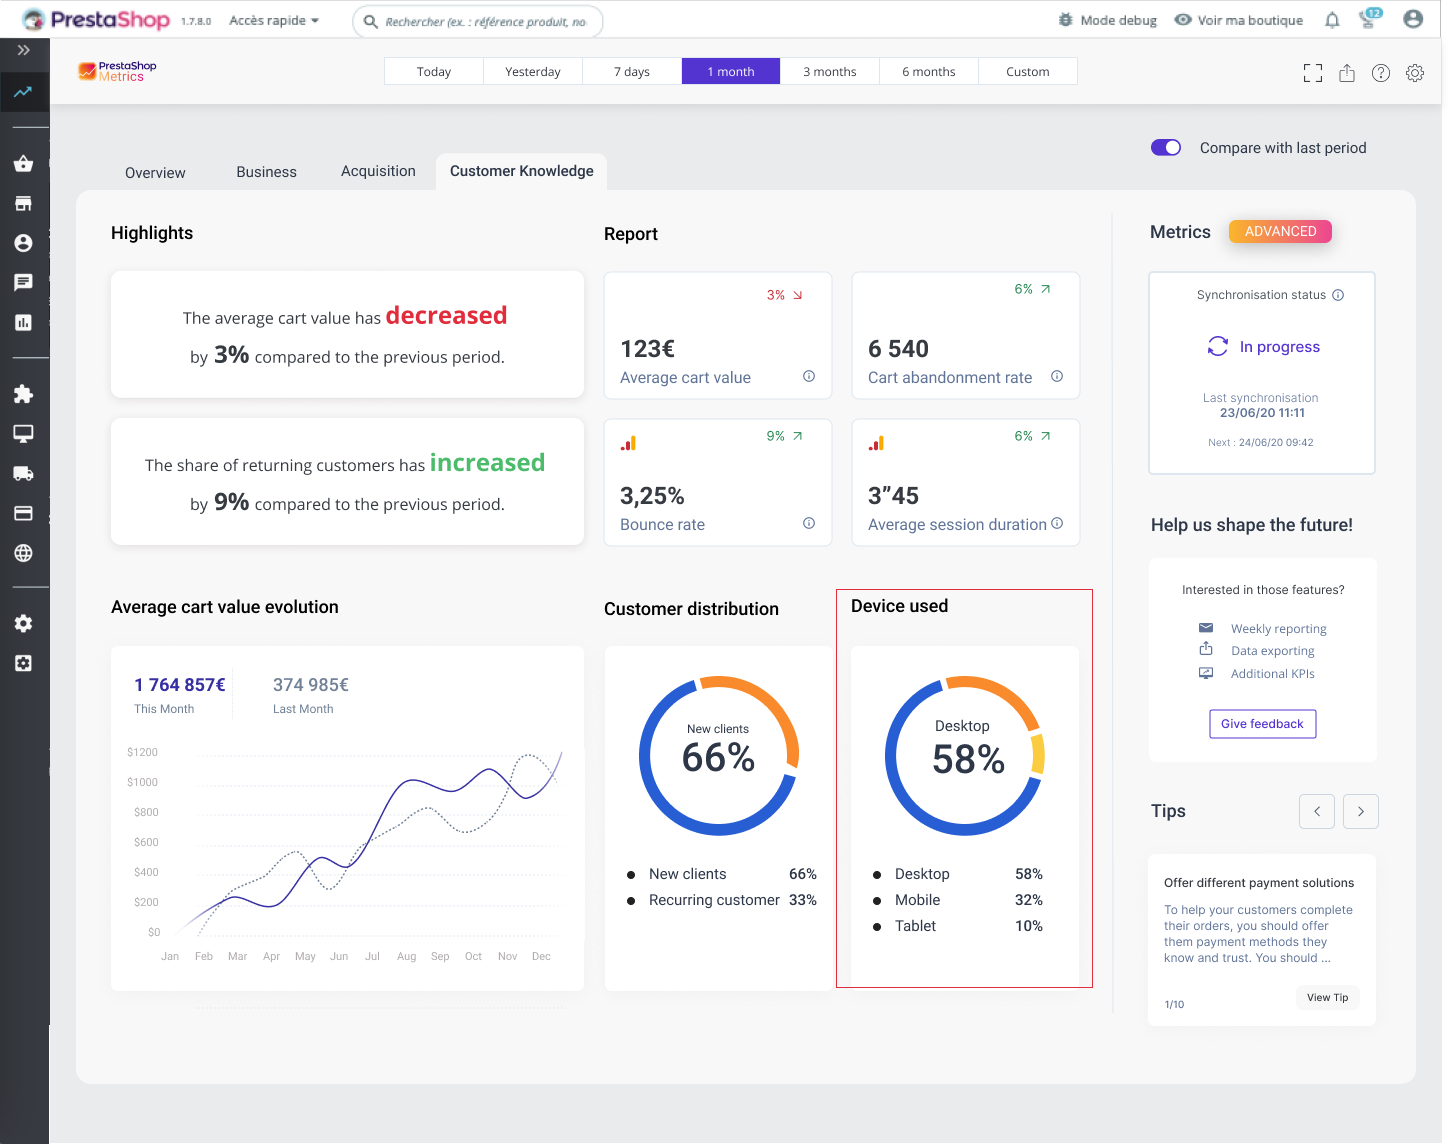
- Device used
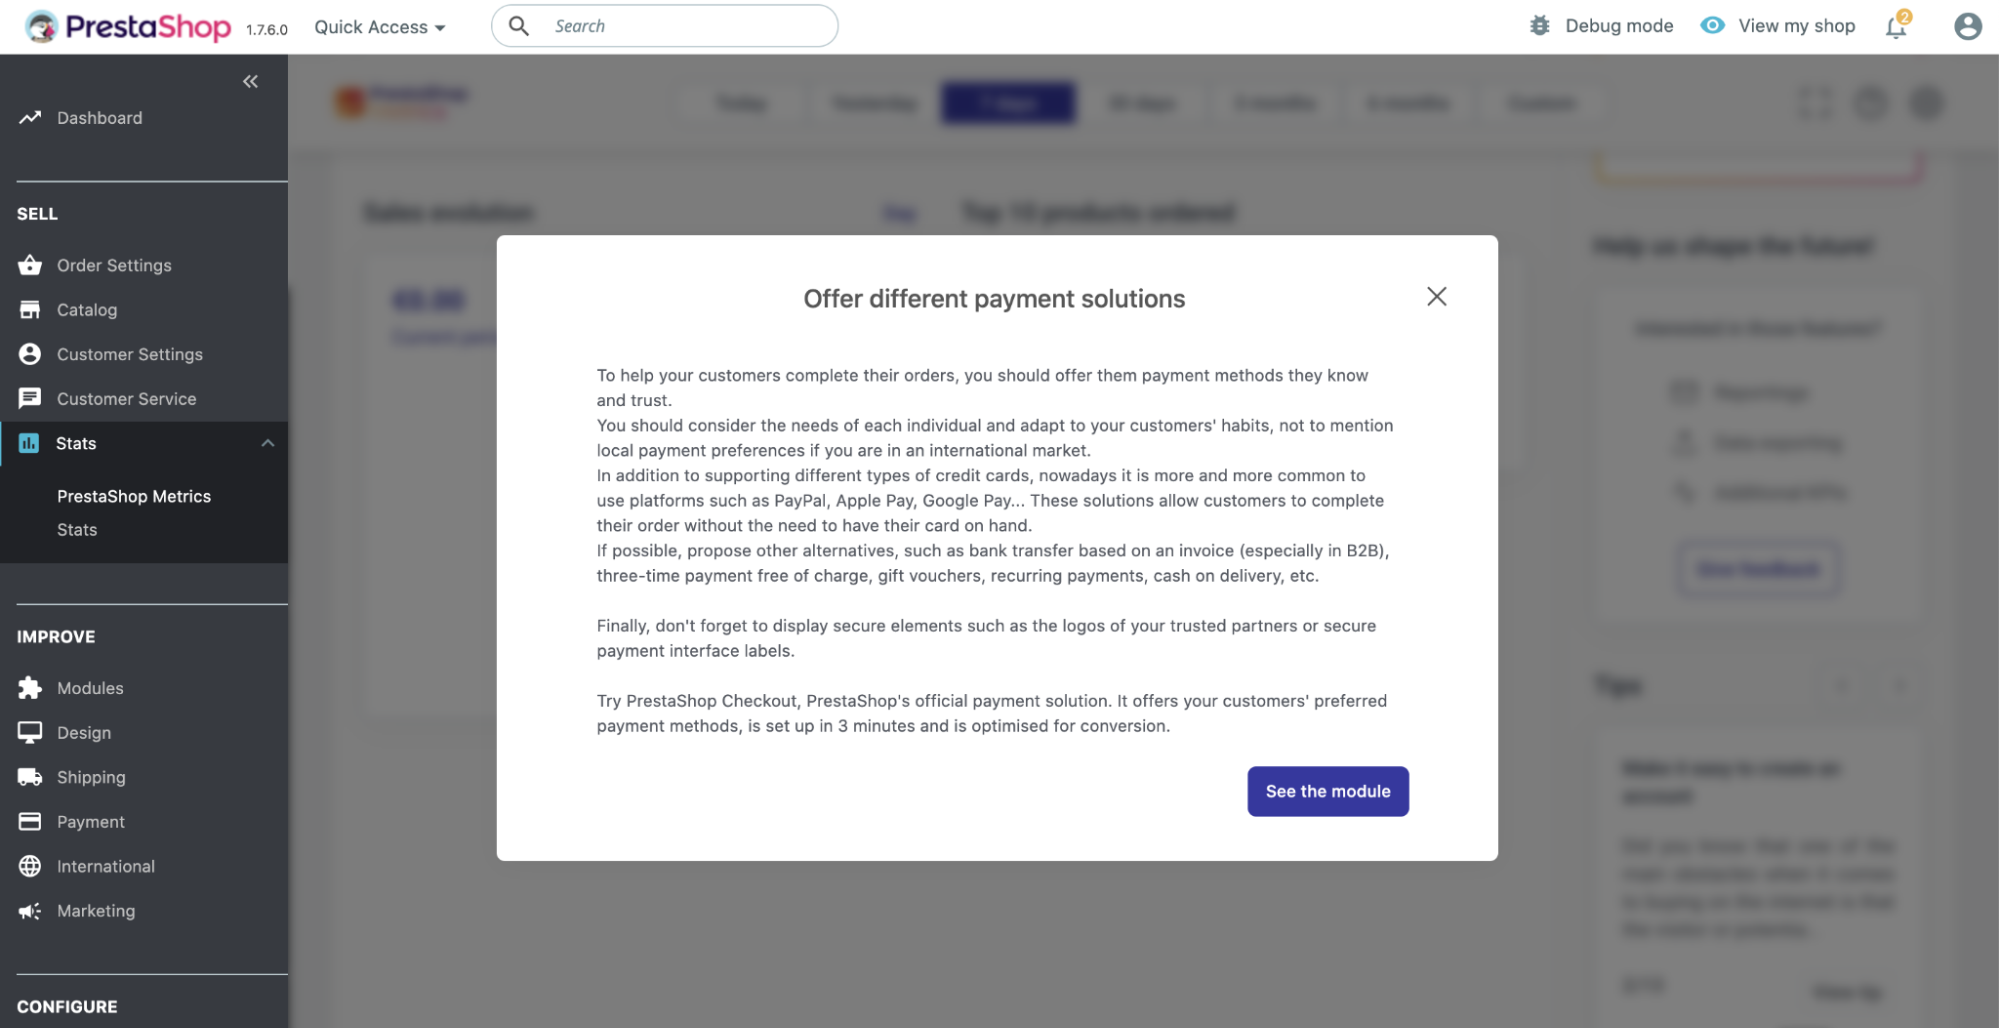
- Tips to help merchants in their decisions
+ a full redesign of the dashboard.
We didn’t include reporting / exporting into the new version because it was not a first priority.
Feature 1: product tour
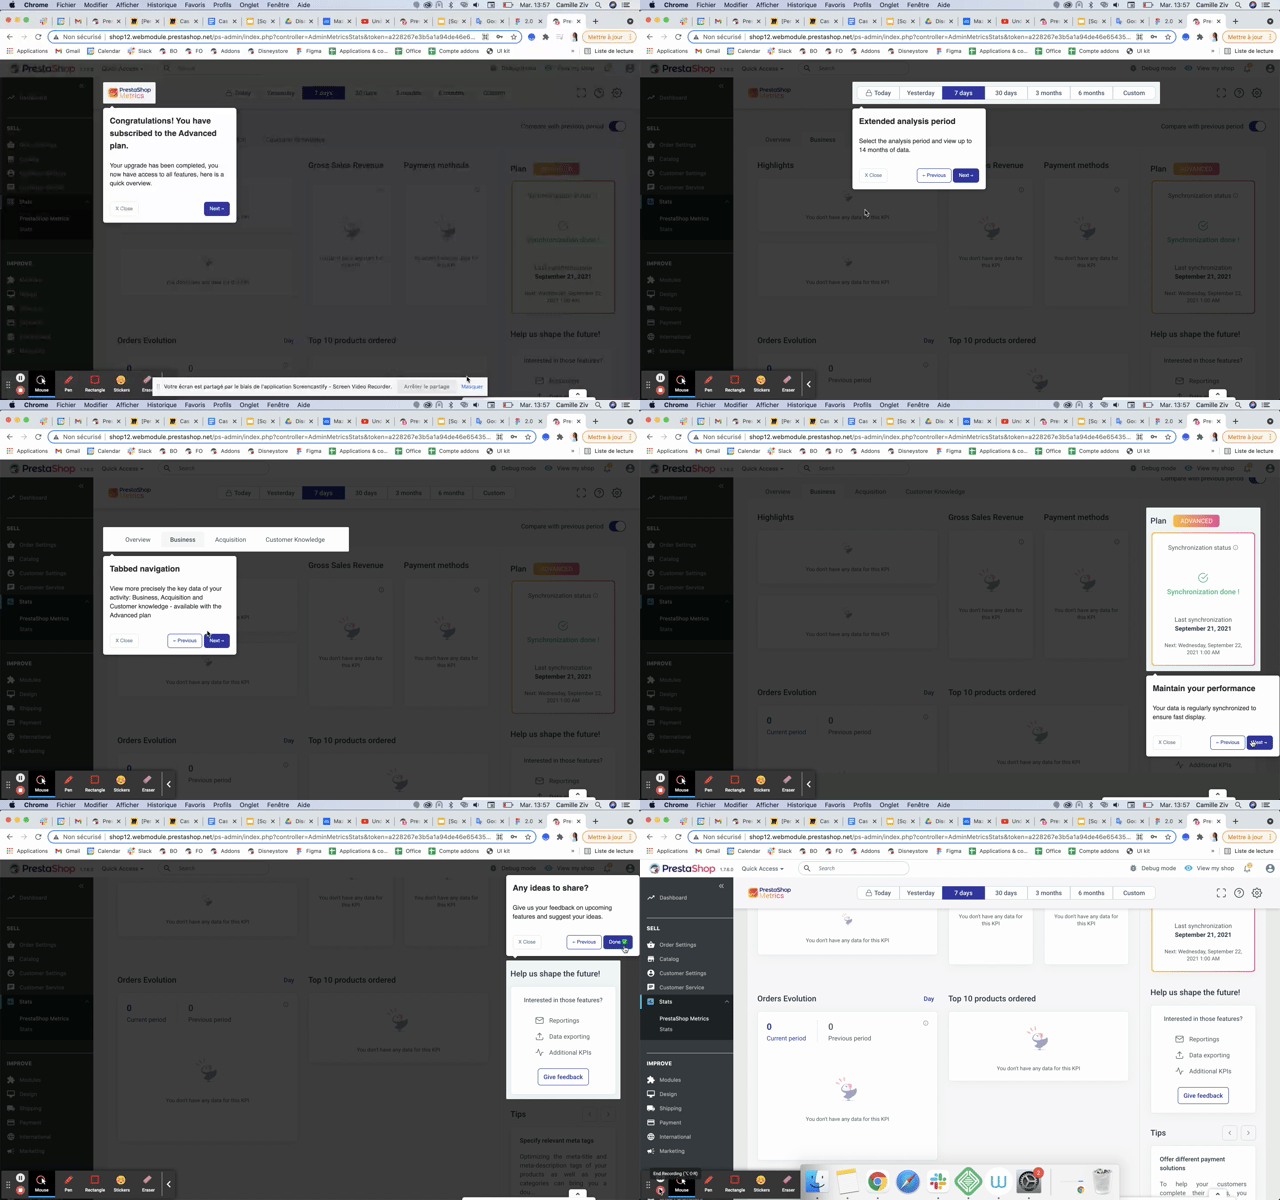
It helps users navigate through the interface for their first connexion. It’s important for the onboarding process and to convert customers.
Feature 2: highlight key data
Feature 3: compare mode

Feature 4: top 10 products
Feature 5: device used
Feature 6: tips for merchants
09
Conclusion and data analysis
After the new version deployment, we saw an increase with the metrics defined earlier. We still have some improvement to do and some features to add, but we’re on track!
Data comparison between the two last versions vs the target for 2021:

As a conclusion, we succeeded in improving user satisfaction, but we’re still far from the target. Moreover, we know pretty well how our users behave, their motivations and day-to-day tasks. It will help us to be more ‘user-centrics’ for future versions and significantly increase our metrics.
If I had 3 lessons to remember for future improvements, it will be to:
- Stay connected with users as much as possible
- Tests at every steps and ask for feedback all the time
- Be humble towards the product and listen carefully

